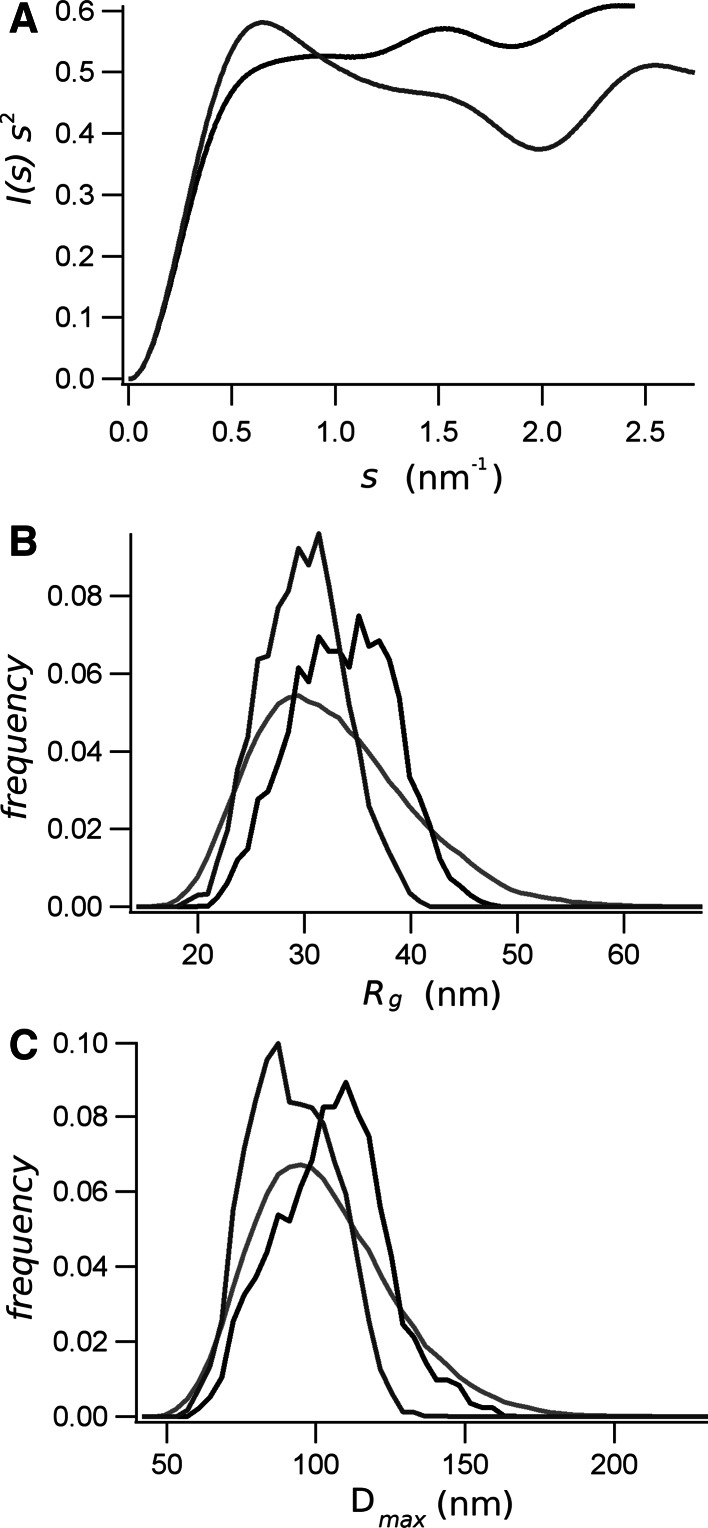
Fig. 7.
a Kratky plot of the native (black line) and the phosphorylated (gray line) RD. Results of the EOM study showing the distribution of the R g (b) and D max (c). The distributions of the random pool are shown in light gray, and those of the selected ensemble for native RD are in black and for phosphorylated RD in dark gray

