Fig. 5.
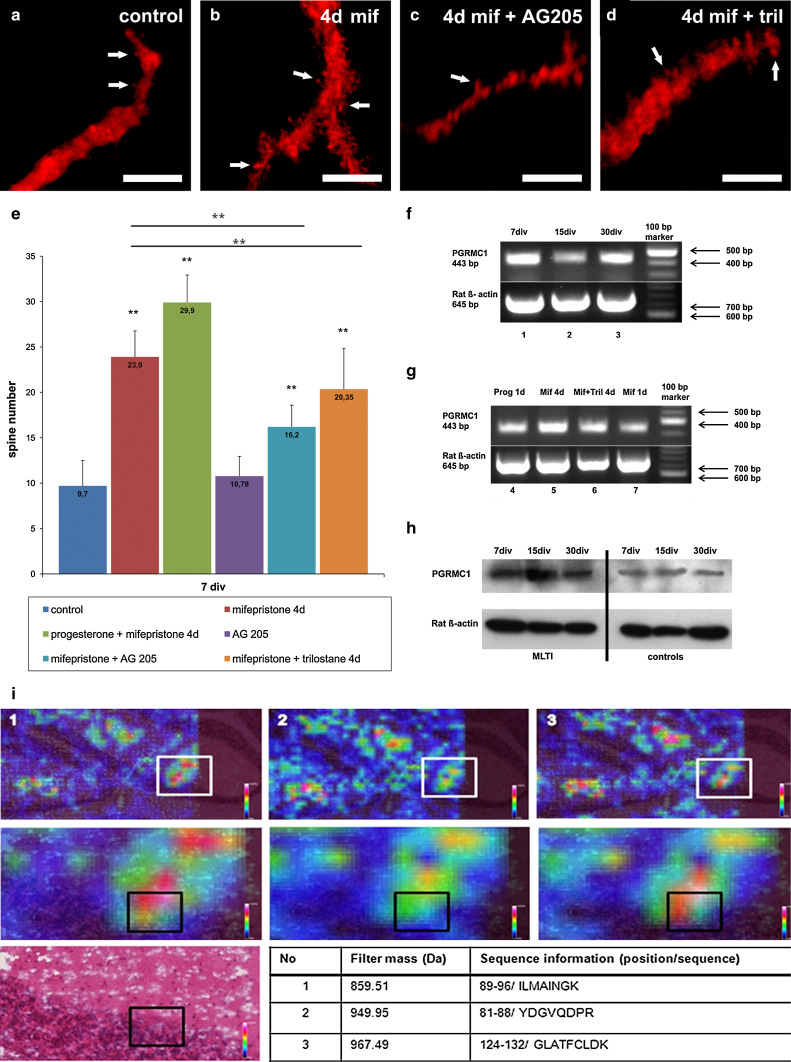
Long-time incubations. Spine number in calbindin-labeled PC (red, 7 div) in controls (a), after MLTI (b), MLTI combined with AG205 (c), and MLTI plus trilostane (d); 4d 4 days. e Quantitative analysis of PC spine number in cell cultures treated with mifepristone in combination with progesterone, AG205, and trilostane at different developmental ages. Relevant significances were added to the diagram; error bars SD. f Semi-quantitative reverse transcription-PCR analysis of the physiological PGRMC1-mRNA distribution in untreated cerebellar slices after 7 (1), 15 (2), and 30 (3) div. g Semi-quantitative reverse transcription-PCR of slice cultures treated with progesterone for 1 day (1d, 4), mifepristone for 4 days (4d, 5), mifepristone and trilostane for 4 days (4d, 6) and mifepristone for 1 day (1d, 7). h Western blot of slices after 7, 15, and 30 div after long-time incubation with mifepristone (MLTI) compared to controls. i Localization of PGRMC1 within PC, checked by MALDI imaging. The tissue was digested using trypsin and peptides of PGRMC1 were analyzed concerning their colocalization with PC. The peptide intensity in different areas of the cerebellum is visualized by colors according to the color bars depicted on each slide. The MALDI image is colocalized with the appropriate H&E stain. White rectangles enclose zoomed areas. 1, 2, and 3 correspond to three different peptide masses described in the table by mass, location, and sequence information (1-letter symbol for each amino acid). Black rectangles in the zoomed images and the H&E image: localization of a single PC. White arrows indicate dendritic spines. Scale bars (a–d) 5 μm

