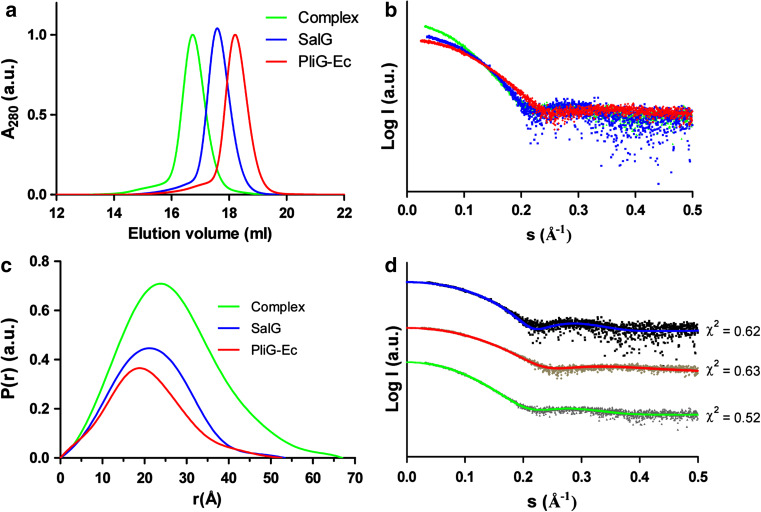
Fig. 1.
Solution properties of SalG (blue curves), PliG-Ec (red) and their complex (green). a Elution profiles (normalized to the absorbance maximum) of the three samples obtained on an analytical SEC column. b Small-angle X-ray scattering data for the three samples normalized by protein concentration. c Corresponding distance distribution functions. d Fits between the experimental SAXS data (black dots) for the three samples and the theoretical scattering curves (coloured lines) calculated from the corresponding crystal structures (PliG-Ec:PDB ID 4DY3, SalG:PDB ID 3MGW and PliG-Ec/SalG complex: this work). The goodness-of-fit (χ 2) values are reported for each curve. The fits for the three samples were displaced vertically for clarity

