Fig. 1.
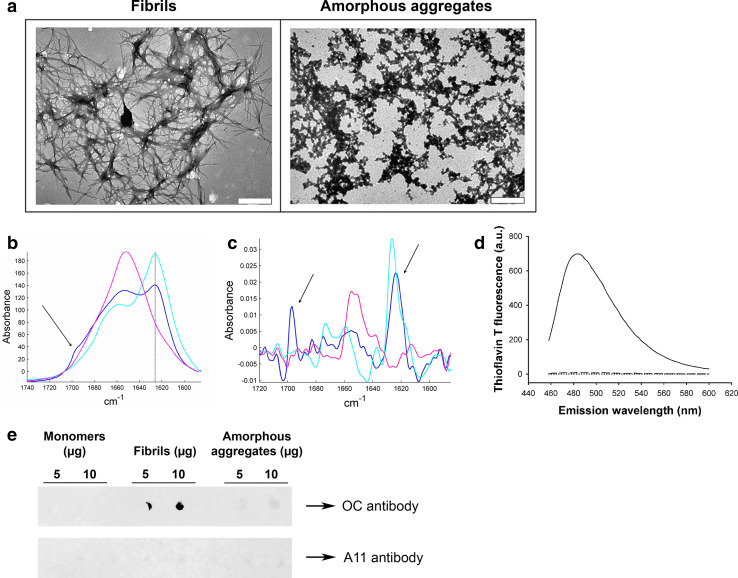
Characterization of lysozyme species. a Negative stained TEM images of lysozyme fibrils (left) and amorphous aggregates (right). The scale bar represents 500 nm. b Infrared spectrum of lysozyme monomers (pink), amorphous aggregates (blue), and fibrils (cyan). Spectra were scaled for identical Amide I area (1,711–1,590 cm−1). The 1,625 cm−1 peak (solid line) is characteristic of β-sheets, and the presence of an additional peak at 1,695 cm−1 (arrow) is the spectral signature of antiparallel β-sheets. c 2nd derivative of the infrared spectra shown in b (same color code). For better visualization, those derivatives have been reversed. The arrows point to the 1,625 and 1,695 cm−1 peaks. d ThT fluorescence assay in the presence of 0.8 μM of either lysozyme fibrils (solid line), monomers (dotted line), or amorphous aggregates (dashed line) (λex: 440 nm). e Dot blot of lysozyme monomers (left), fibrils (middle), and amorphous aggregates (right) using the fibril-specific OC antibody (upper panel) or the oligomer-specific A11 antibody (lower panel)

