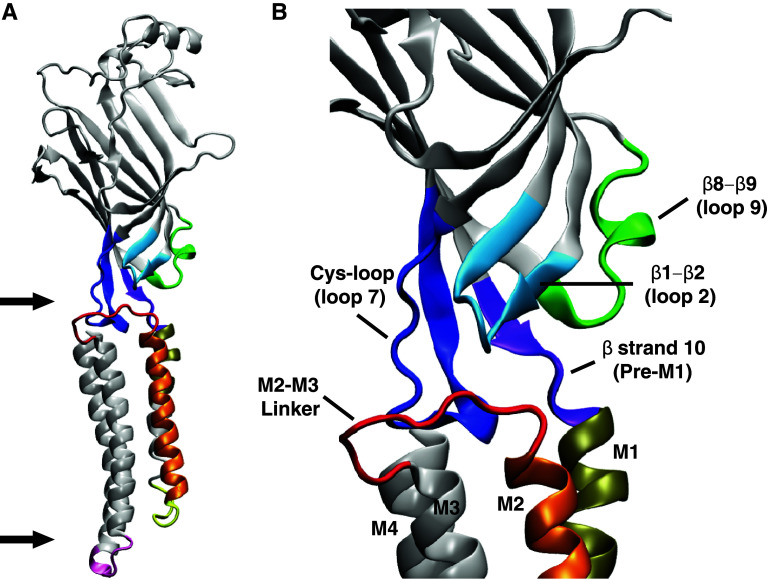
Fig. 2.
a Schematic of a single subunit indicating the extracellular-transmembrane domain and transmembrane-intracellular domain interfaces (arrows). The intracellular domain has been omitted. b A higher magnification view of a single subunit showing the elements of the contributing to the interface between extracellular and transmembrane domains. The elements are; loop 9 (green), loop 2 (light blue), loop 7 (dark blue), pre-M1 (purple) and N terminus of M1 (olive). Also shown are the other transmembrane α helices, including the pore-lining M2 (orange). The images were made using the crystal structure of the C. elegans α GluClR 3RIF [5]

