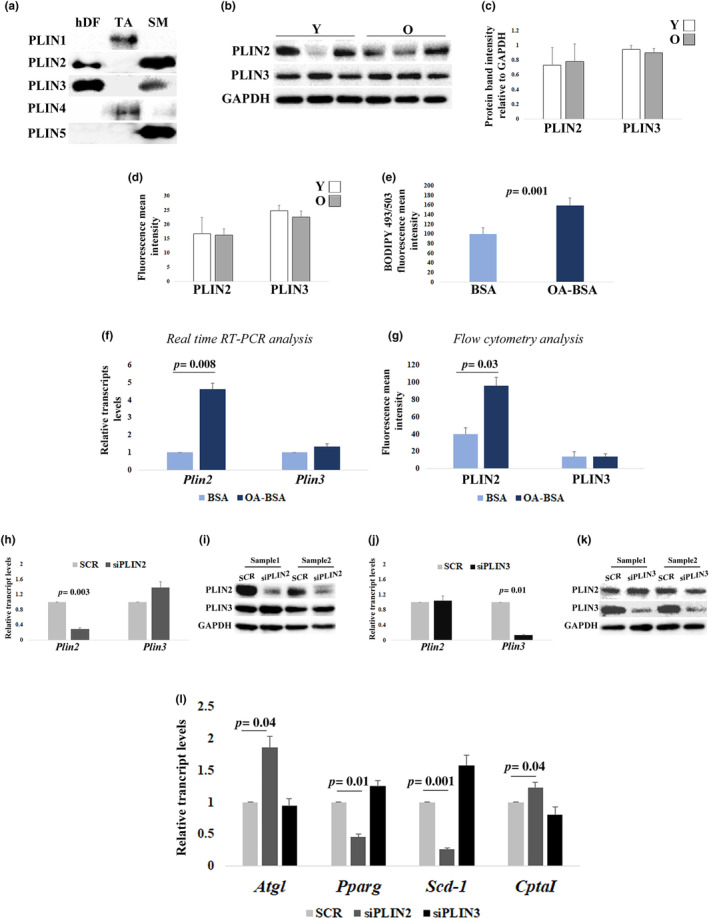
FIGURE 1.

Perilipins (PLINs) expression analyses and effects of PLIN2 or PLIN3 downregulation in human dermal fibroblast (hDFs) from young (Y) and old donors (O). (a) Representative immunoblotting image of PLINs in a sample of hDFs. Adipose tissue (AT) and skeletal muscle (SM) were used as positive control for PLINs expression. (b and c) Western blotting analysis of PLIN2 and PLIN3 in hDFs from three young (Y) and three old (O) subjects. PLIN2 and PLIN3 levels are normalized to GAPDH levels. (d) Flow cytometry analysis of PLIN2 and PLIN3 levels in hDFs from three Y and three O. (e) Flow cytometry analysis of BODIPY 493/503 fluorescence intensity in three hDFs treated with oleic acid–BSA (OA‐BSA) compared to three controls (BSA). (f) Real‐time RT‐PCR analysis of Plin2 and Plin3 expression in 11 hDFs samples, from both Y and O, treated with BSA or OA‐BSA. (g) Flow cytometry analysis of PLIN2 and PLIN3 levels after OA‐BSA treatment in three hDFs samples. (h–k) Real‐time RT‐PCR and western blotting analysis of PLIN2 and PLIN3 after (h and i) PLIN2 downregulation (siPLIN2) and (j and k) PLIN3 downregulation (siPLIN3), compared to controls (SCR). (l) Atgl, Pparg, Scd‐1, and CptaI real‐time RT‐PCR analysis after siPLIN2 and siPLIN3 treatment in11 hDFs samples, from both Y and O. Data are expressed as mean ± SE. Student's t test was applied.
