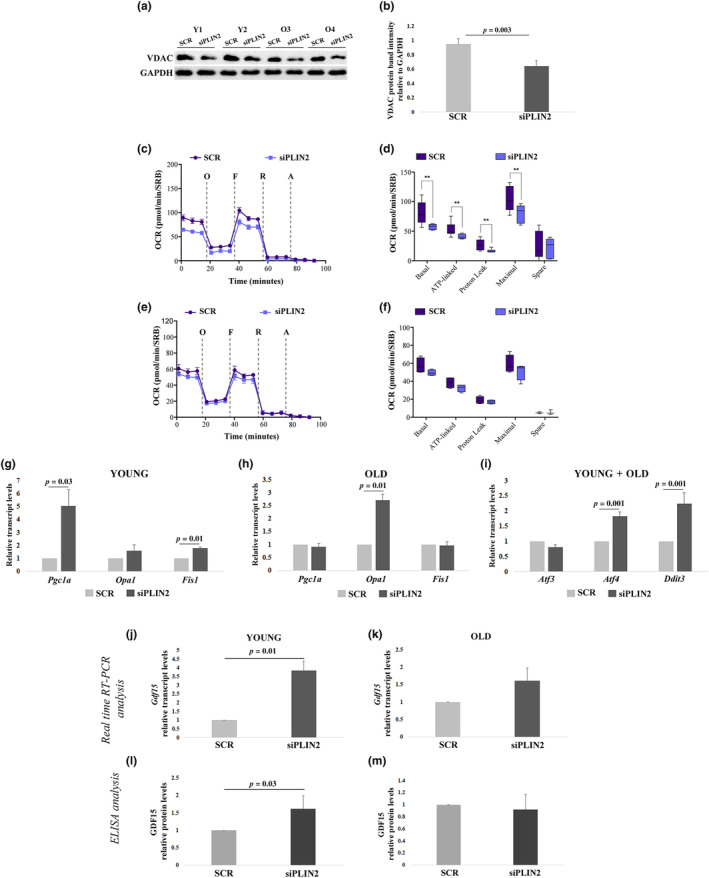
FIGURE 3.

Mitochondrial functionality and expression analyses in hDFs form young (Y) and old (O) donors after PLIN2 downregulation. (a and b) Representative immunoblotting image and quantification of VDAC1 in four hDFs, two from Y and two from O donors, after siPLIN2 treatment compared to controls (SCR). (c–f) MitoStress Test in hDFs from three Y and three O donors after siPLIN2 treatment compared to controls using Seahorse XFe96 platform. (c,e) Oxygen consumption rate (OCR) profile of hDFs from Y (c; n ≥ 3) and O (e; n ≥ 3) determined upon injection of 1 μM oligomycin (O), 1.5 μM FCCP (F), 1 μM rotenone (R), and 1 μM antimycin A (A) in Seahorse XFe medium. FCCP concentration was previously determined by titration. Data are normalized on SRB absorbance. (d,f) Determination of different OXPHOS parameters: basal respiration, ATP‐linked respiration, proton leak, maximal OCR and spare respiratory capacity of hDFs from Y (d) and O (f) calculated from the data obtained in OCR profiles. (g and h) Real‐time RT‐PCR analyses of Pgc1α, Opa1, and Fis1 expression in hDFs from (g) six Y and (h) five O donors. (i) Real‐time RT‐PCR analysis of Atf3, Atf4, and Ddit3 expression after siPLIN2 treatment in 11 hDFs samples from both Y and O donors (young+old) grouped together, as the gene expression fold changes in PLIN2 KD samples compared to controls (scramble) were comparable between hDFs from young and elderly donors. (j,k) Real‐time RT‐PCR analysis of Gdf15 expression after siPLIN2 treatment in hDFs from (j) six Y and (k) five O donors. (l,m) ELISA analysis of GDF15 secretion in the culture media of hDFs from (l) six Y and (m) five O donors, expressed as fold change compared to the scramble‐treated samples (SCR). Data are expressed as mean ± SE. Student's t test was applied. For ELISA analysis, Mann–Whitney U test was applied.
