
FIGURE 4.
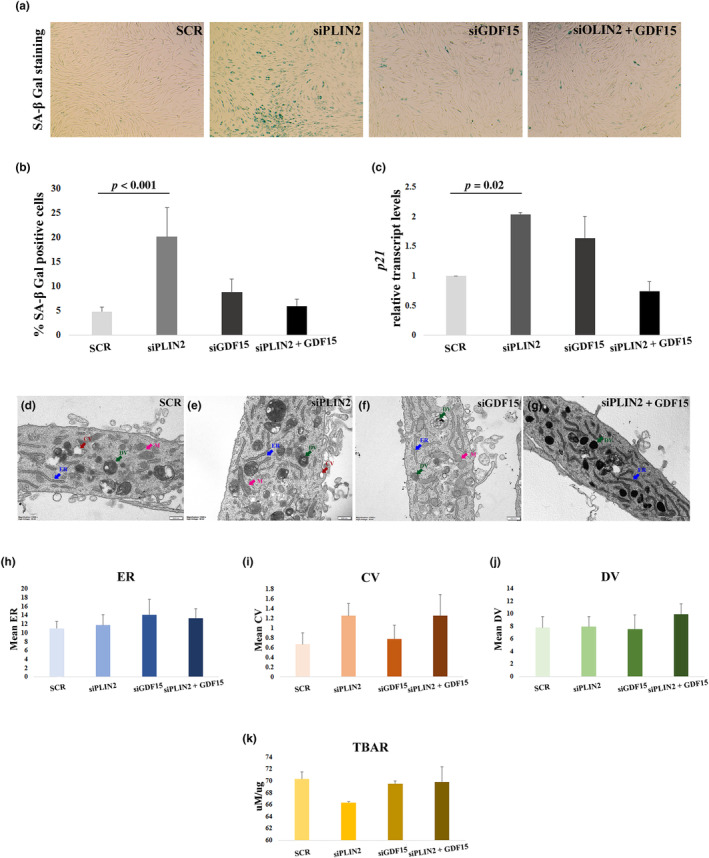
Cell senescence induction and transmission electron microscopy (TEM) analysis in hDFs from young donors. (a) Representative images of β‐galactosidase (SA‐β Gal) staining in hDFs after PLIN2 (siPLIN2), GDF15 (siGDF15), and PLIN2 and GDF15 combined (siPLIN2 + GDF15) and scramble (SCR) siRNA treatment. (b) Quantification with Fiji software of the percentage of senescent cells after experiment as in (a). At least five images per sample were used for quantification. The experiment was performed in three cell lines. (c) Real‐time RT‐PCR analysis of p21 expression in six hDFs samples, after siPLIN2, siGDF15, siPLIN2 + siGDF15, or SCR treatment. (d–g) Representative images of TEM analysis after PLIN2 (siPLIN2), GDF15 (siGDF15), and PLIN2 and GDF15 combined (siPLIN2 + GDF15) and scramble (SCR) siRNA treatment. Arrows indicate endoplasmic reticulum (ER, blue), clear vacuoles (CV, red), dark vacuoles (DV, green), and mitochondria (M, magenta). (h–J) Quantification of (h) ER, (i) CV, and (j) DV. (k) Thiobarbituric acid reactive substances (TBARS) analysis. Data are expressed as mean ± SE. Student's t test was applied.