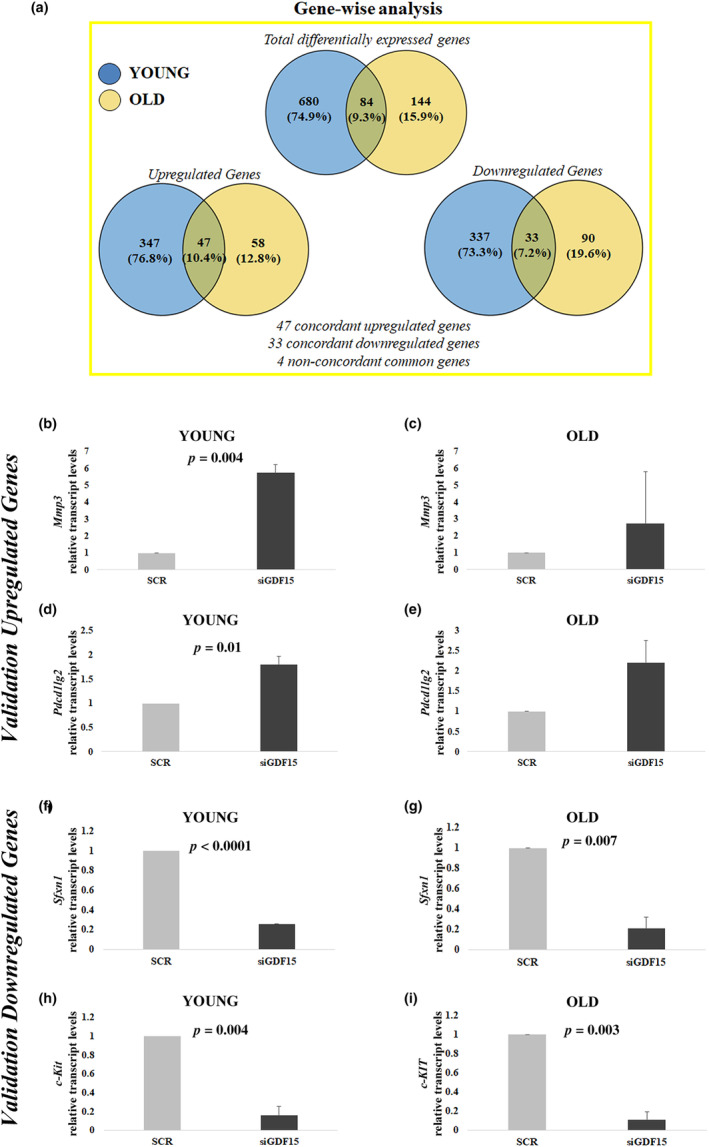
FIGURE 5.

Whole‐genome RNA‐Seq analysis. (a) Representation of total and common differentially expressed genes in hDFs from three young and three old donors after GDF15 knockdown. (b–i) Validation of selected upregulated and downregulated genes (Mmp3, Pdcd1lg2, Sfxn1, and c‐Kit) emerged from RNA‐Seq, by real‐time RT‐PCR. Data are expressed as mean ± SE. Student's t test was applied.
