FIGURE 1.

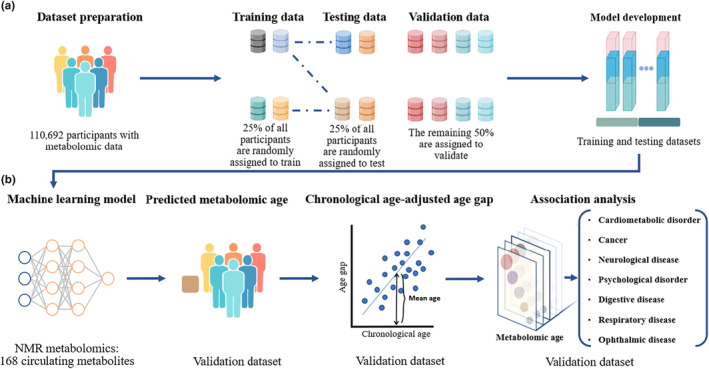
Flowchart for the development of metabolomic age and its association with the risk of chronic diseases (a) refers to the division of datasets; (b) refers to the development of metabolomic age and its linkage to chronic diseases.

Flowchart for the development of metabolomic age and its association with the risk of chronic diseases (a) refers to the division of datasets; (b) refers to the development of metabolomic age and its linkage to chronic diseases.