
FIGURE 2.
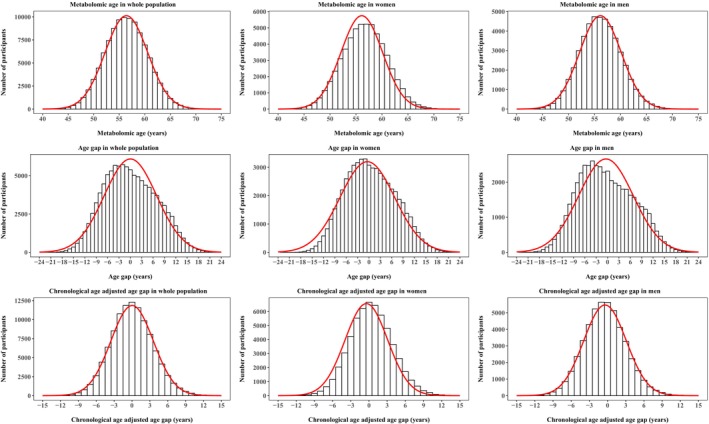
Distribution of metabolomic age in women and men. Age gap was calculated by subtracting chronological age from metabolomic age. Chronological age‐adjusted age gap was calculated with use of regression models. Red curves represent the trend of the distribution.