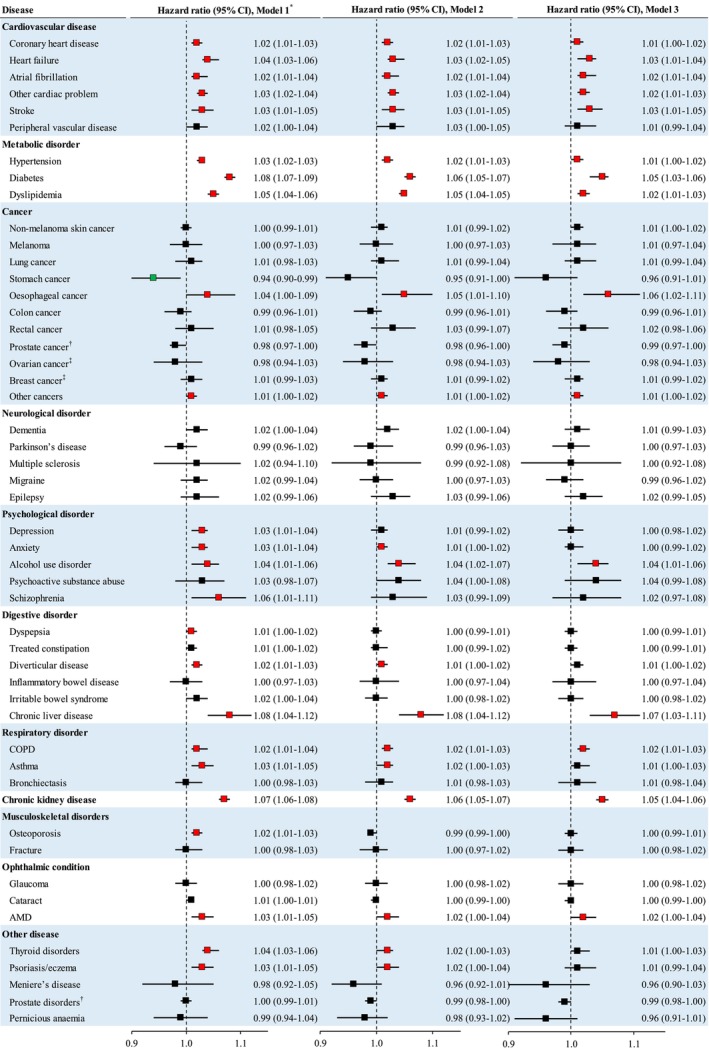
FIGURE 3.

The association between each year increment in chronological age‐adjusted age gap and risk of individual diseases in the validation population. Age gap was calculated by subtracting chronological age from metabolomic age. Chronological age‐adjusted age gap was calculated with the use of regression models. *Cox proportional regression models were used to examine the association between chronological age‐adjusted age gap (each year increment) and incidence of individual chronic diseases. Model 1 was unadjusted; Model 2 was adjusted for Model 1 plus age, sex, ethnicity, education, household income, diet score, alcohol consumption, physical activity, smoking, sleep duration, fasting duration, and GRS for longevity; Model 3 was adjusted for Model 2 plus BMI, high cholesterol, hypertension, and antihypertensive and lipid‐lowering medications (hypertension or antihypertensive medication use at baseline was not adjusted for the analysis of incident hypertension given these participants with hypertension or antihypertensive medication use were excluded from the analysis). Red color squares refer to significantly positive associations while green color squares refer to significantly inverse associations. The significant associations in Model 1 were defined as p‐value<0.05 after adjustment for false discovery rate. †These analyses were conducted among men only. ‡These analyses were conducted among women only. AMD, age related macular degeneration; CI, confidence interval; COPD, chronic obstructive pulmonary disease; HR, hazard ratio.
