
FIGURE 6.
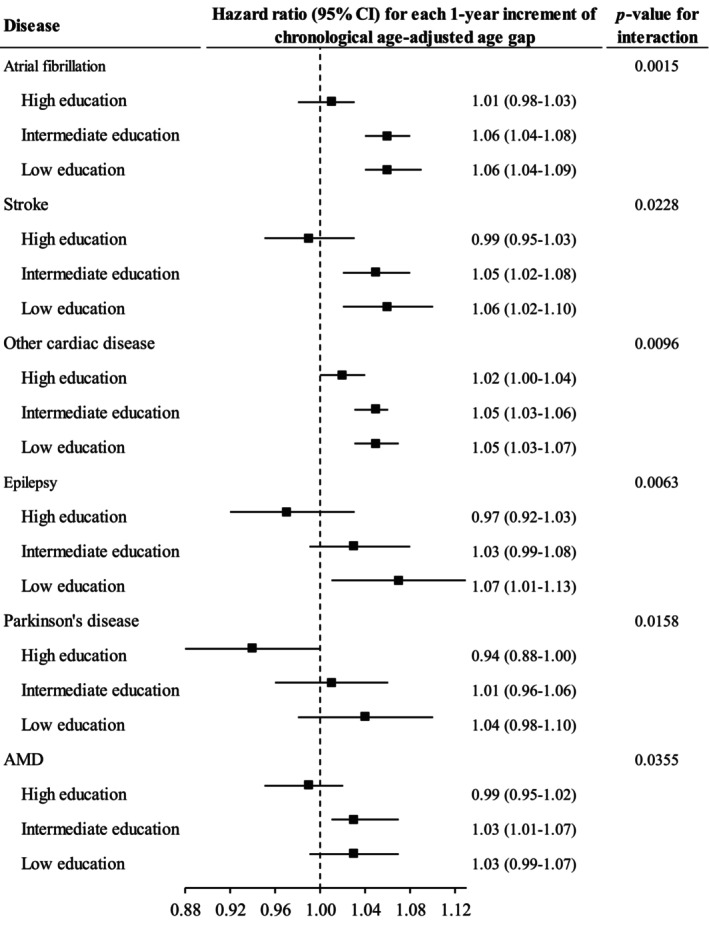
The association between chronological age‐adjusted age gap and incidence of chronic diseases moderated by education. Cox proportional regression models were used to test whether education modified the association between chronological age‐adjusted age gap and incidence of chronic diseases. Only the results with significant interaction are shown in this figure. Horizontal lines indicate the range of the 95% confidence interval. The vertical dash lines represent the hazard ratio of one. AMD, age‐related macular degeneration; CI, confidence interval.