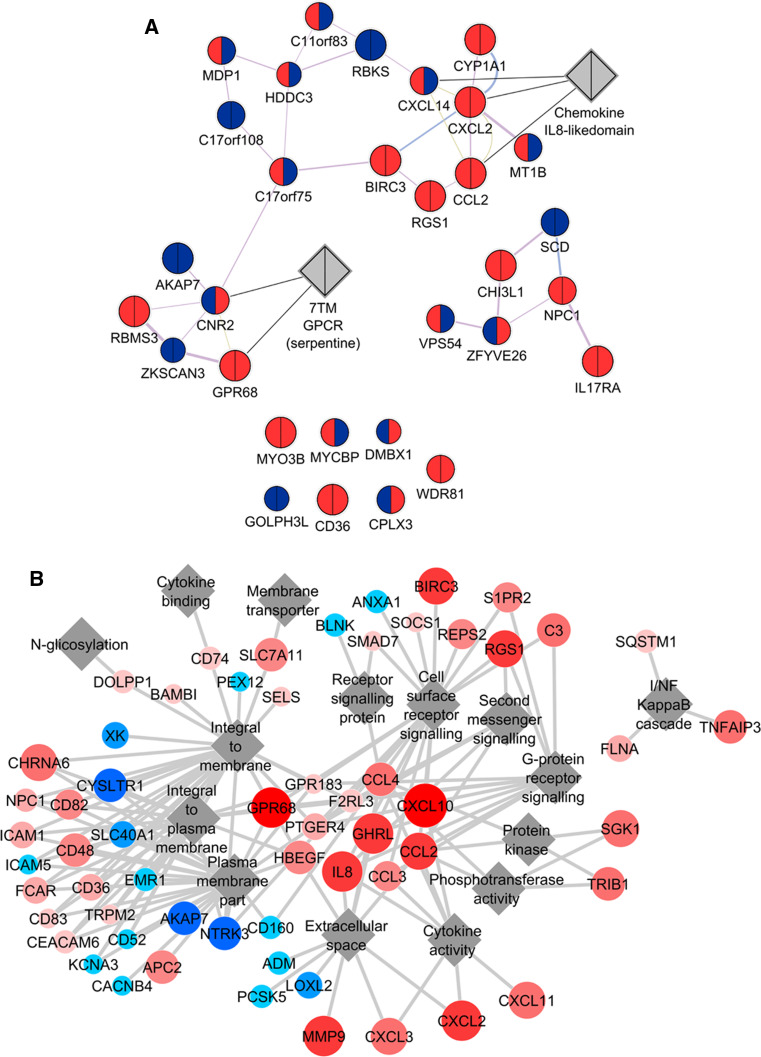
Fig. 4.
Network analysis of genes modulated by a combined EV + TNF treatment. a Interaction network of genes modulated by EV + TNF treatment compared with TNF treatment alone. Based on the results of the microarray, GeneMania plugin [16–18] for Cytoscape was used to find and visualize functional clusters of significantly altered genes. Gene sets showing significant alteration in any one of the three treatments compared to control (pairwise ANOVA) were queried for co-expression, protein–protein interactions, shared domains, and co-localization. The program was set to find at maximum 20 relevant attributes. This interaction network shows genes significantly differentially expressed after a combined EV + TNF treatment compared to treatment with TNF alone. Upregulation is indicated by red, downregulation by blue, the left side of the nodes is coloured according to gene expression after TNF treatment, the right side according to gene expression after the combined EV + TNF treatment. b Network of GO terms only enriched after a combined EV + TNF treatment, but not TNF treatment alone. Beyond single-gene analysis, gene set enrichment analysis (GSEA) was also applied, using the standard implementation of the method by Subramanian et al. [19], currently called GSEA v3.1, available from the Broad Institute via the web (http://www.broadinstitute.org/gsea/index.jsp). Given the limited number of conditions, we did all analyses with 1,000 permutations based on the genotype. Gene sets were obtained from the c2, c3, c4, and c5 branches of the molecular signatures database (MSigDB v.3.1) [20], excluding gene sets that contain <15 or more than 500 entities. As a screening test, we investigated all datasets in the corresponding branches of MSigDB and counted the number of gene sets showing a significant enrichment at a false detection rate (FDR) <25 % at nominal p value <5 %. GSEA results of gene ontology (GO) terms (c5) were visualized using Cytoscape and its enrichment map [21]. For network generation in the enrichment map, we used the standard settings (p value cut-off 0.005; FDR cut-off 0.1; overlap coefficient 0.5; combined constant 0.5). Here, the top 60 genes of those sets only enriched after the combined EV + TNF treatment, but not after TNF treatment alone, were plotted against related, enriched GO terms. In the figure, genes are connected to the relevant terms. Colour and node size represent expression after a combined EV + TNF treatment. Upregulation is indicated by red, downregulation by blue

