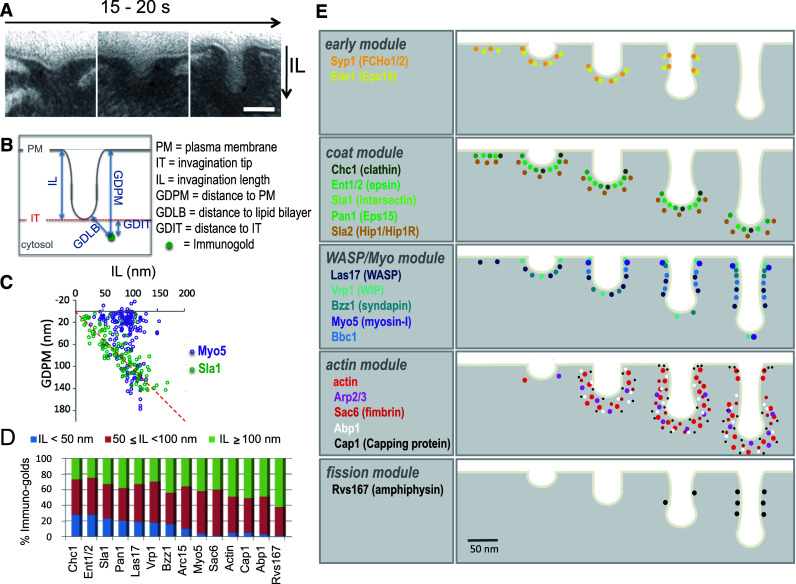
Fig. 2.

Ultrastructural analysis of endocytic budding by quantitative immuno-electron microscopy (QIEM) a Electron micrographs showing plasma membrane invaginations labeled with immuno-golds against an endocytic coat protein (Sla1) on ultrathin sections of yeast chemically fixed and resin-embedded. Scale bar 100 nm (reproduced from [23]). b Scheme indicating the parameters used to describe the position of the immuno-golds labeling endocytic proteins relative to the invagination (reproduced from [23]). c Dot plot representing the distance of immuno-golds to the basal plasma membrane (PM), versus the length of the associated invagination, for the coat component Sla1 and the myosin-I, Myo5 (data are from [22]). d The average length of the invaginations labeled for different endocytic proteins significantly increases according to their sequential recruitment, only for proteins recruited concomitant with or after Vrp1 and Bzz1. The data indicate that the emergence of membrane curvature coincides with the arrival of these proteins, and that once curvature is generated, the length of the invaginations can be used as a parameter to describe their age. Events occurring before membrane curvature or after scission are not studied by QIEM (data are from [23]). The X-axis represents the level of the basal PM and the red dotted line indicates the position of the invagination tip. In this kind of graph, the spatiotemporal organization of the endocytic protein along the invagination can be monitored. In the examples shown, the position of the immuno-golds indicates that Sla1 remains associated with the tip of the invagination as it grows inside the cytosol. Myo5 is recruited later and appears associated with the invagination base most of the time. In longer invaginations though, just before fission occurs, a pool of Myo5 appears associated with the invagination tip. e The spatio-temporal distribution of 18 endocytic yeast proteins based on QIEM studies [22, 23]. The mammalian homologues or functional counterparts are shown between parentheses
