Fig. 1.
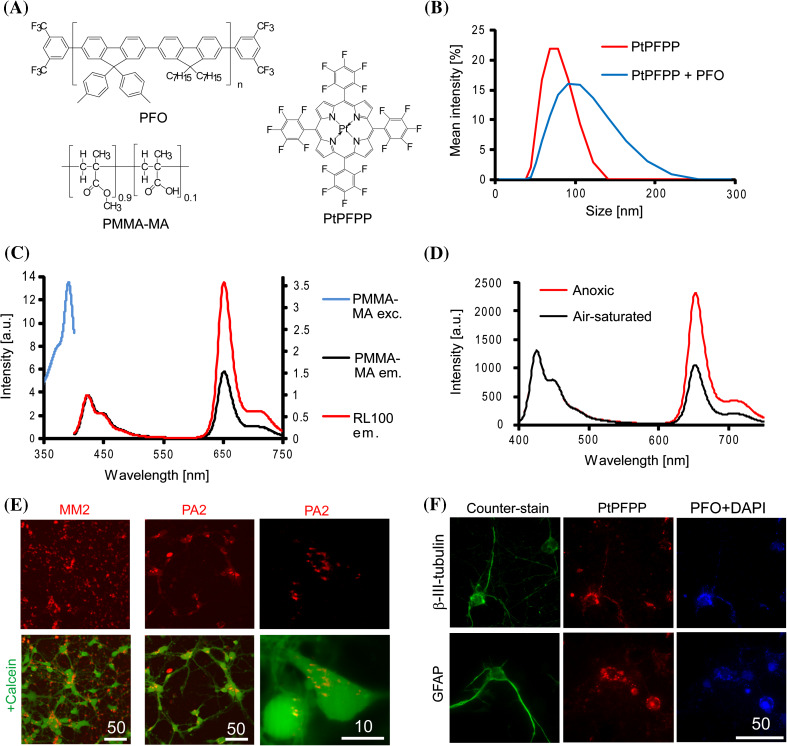
Initial evaluation of PMMA-MA-based nanoprobes with neural cells. a Chemical structures of nanoparticle-forming components; b size distribution of the two probe samples obtained on a Zetasizer analyzer; c luminescence excitation and emission spectra of PA2 compared with MM2, measured at 0 % O2 at 37 °C. d Corrected emission spectra of PA2 at air saturation and anoxic conditions (λ exc 390 nm, 25 °C). e Confocal images of neural cells (E18, 6 DIV) stained with MM2 and PA2 (1 µg ml−1, 16 h, red) and co-localised with cell bodies by Calcein Green staining (1 µM, 0.5 h, green). Right: localisation of PA2 in mouse primary neurons (E16, 8 DIV) at higher magnification. Optical sections are 0.4 µm thick. f Wide-field images of neural cells stained with PA2 (1 µg ml−1, 16 h): PtPFPP (red), PFO and DAPI (blue) signals and counter-staining (green) with antibodies against β-III-tubulin (mature neurons) and GFAP (astrocytes). Scale bar unit is µm

