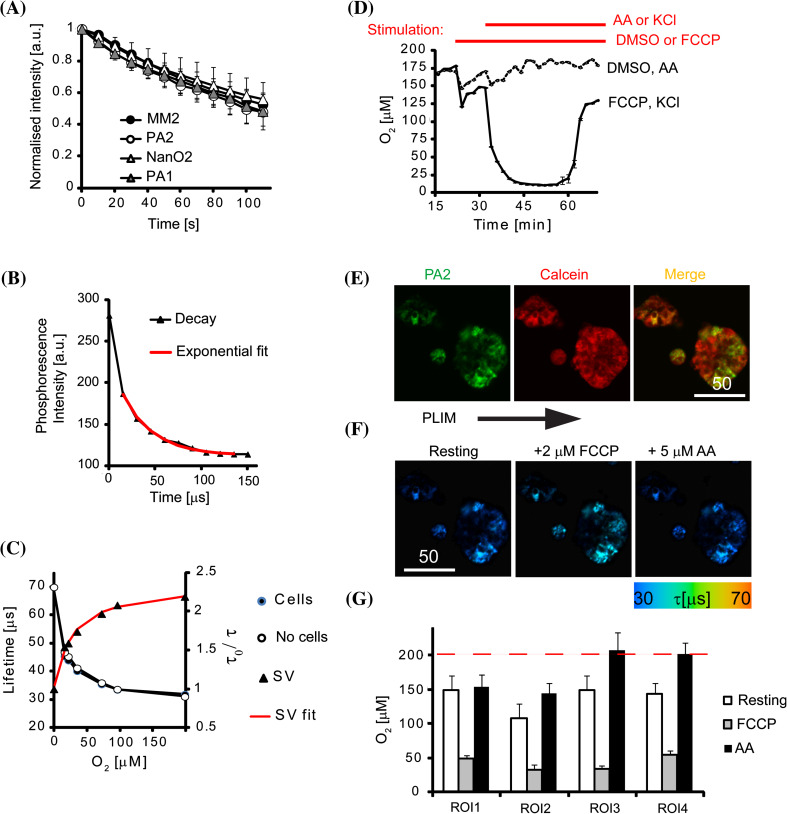
Fig. 3.
O2 monitoring experiments with neural cells and PA2. a Photobleaching under continuous illumination on a microscope in comparison with other NP probes (650 nm emission). b Example of phosphorescence intensity decay shown with single-exponential decay fitting curve (red). c O2 calibration and Stern–Volmer (SV) relationship produced with mouse cortical neurons (7 DIV, “cells”) and in solution (“no cells”) on a TR-F reader. Fitting of Stern–Volmer relationship accordingly to two-site model is shown in red (SV fit). d Oxygenation profiles of a confluent monolayer of mouse cortical neurons (7 DIV) stained with PA2 (2.5 µg ml−1; 16 h) and measured on a TR-F reader. After baseline stabilisation, cells were treated with FCCP (500 nM) or DMSO (mock), followed up KCl (50 mM) or AntimycinA (AA, 10 µM), as indicated by red lines (top of the graph). N = 3. e Single optical section of a PC12 cell aggregates stained with PA2 (green) and Calcein Green (red), and merged image. Scale bar in µm. f PLIM images of PC12 aggregates (shown above) at rest and after sequential treatment with FCCP and AA. g Corresponding O2 levels calculated for selected ROIs within the aggregates, N = 5. Dashed line shows air-saturated O2 level

