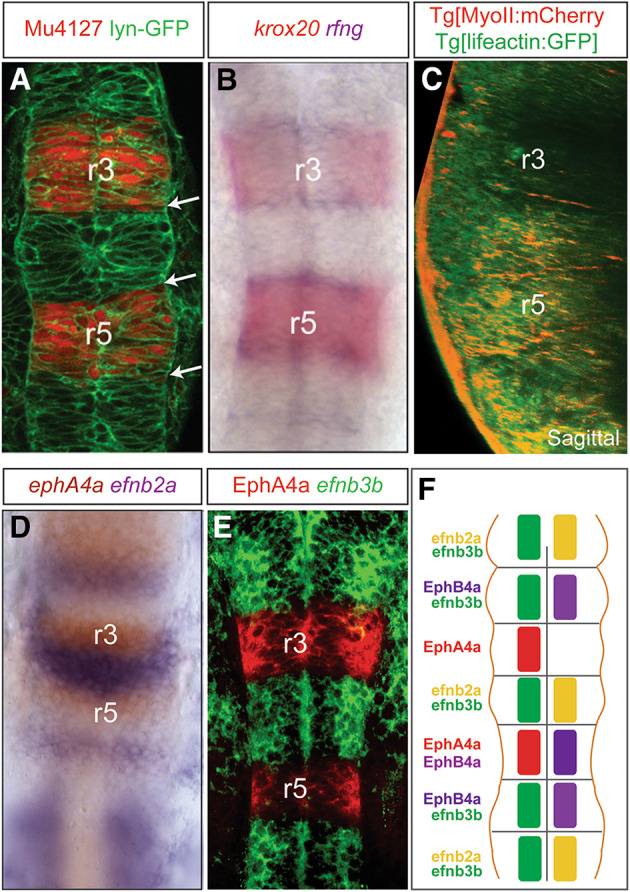
Fig. 1.

Borders of gene expression coincide with rhombomeric boundaries. a Morphological boundaries appear at the borders of rhombomeric gene expression (white arrows); Mu4127 embryos express mCherry in r3 and r5; lyn-GFP marks the plasma membranes; b double in situ hybridization (ISH) showing that segment-restricted gene expression (krox20) in the hindbrain prefigures the allocation of the boundary cell population (rfng-cells in blue). c Physical barriers appear at rhombomeric boundaries as shown by actomyosin cables in double transgenic embryos Tg[myosinII:mCherry]Tg[lifeactin:GFP]. d, e Double ISH with ephA4 and efnb2a or single efnb3b ISH followed by anti-EphA4 staining shows complementary borders of expression for ephrin ligands and Eph receptors; these borders are predicted sites for forward and reverse signaling. f Scheme summarizing the expression Eph receptors and ephrin ligands in specific rhombomeres. Note that although Eph receptors are generally expressed in odd- and ephrin ligands in even-rhombomeres, there are few exceptions: r2 and r6 display overlapping expression of Eph receptor and ephrin ligand. For simplicity, only data from zebrafish were plotted. Dorsal views with anterior to the top, except for C that is a sagittal view with dorsal to the left. r, rhombomere
