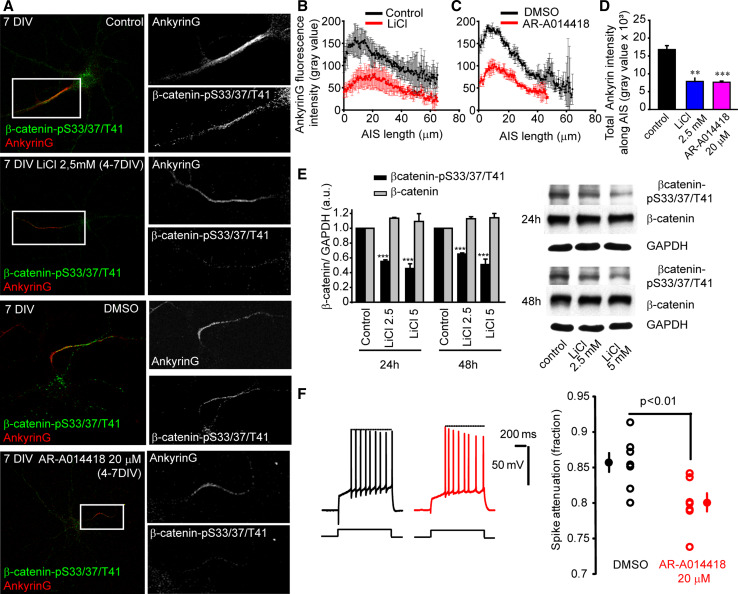
Fig. 6.
GSK3 inhibition and β-catenin-pS33/37/T41 reduction diminishes ankyrinG clustering at the AIS and modifies action potential characteristics. a 7-DIV hippocampal neurons treated with 2.5 mM LiCl or 20 µM AR-A014418 (GSK3 inhibitor) from 4 DIV to 7 DIV and stained for β-catenin-pS33/37/T41 (green) and ankyrinG (red). Boxes indicate the amplified AIS region shown on the right panels (gray scale). b, c Mean ± SEM fluorescence intensity of ankyrinG along the AIS in control, LiCl, or AR-A014418-treated neurons as shown in a. Fluorescence intensity was measured along the AIS every 0.44 µm of 60 neurons from three independent experiments (20 neurons/experimental condition and experiment) using the ImageJ software. d Total ankyrinG fluorescence intensity at the AIS of neurons analyzed in b and c. Graph represents the mean ± SEM. **p < 0.01; ***p < 0.001, t test. Scale bar 50 µm. e β-catenin and β-catenin-pS33/37/T41 expression in control or 2.5 and 5 mM LiCl-treated neurons for 24 and 48 h. Graph represents the mean and SEM of protein expression levels normalized to GAPDH levels in three different experiments. ***p < 0.001, t test. f Reduced amplitude of the last spike in cultured slices neurons “in vivo” treated with AR-A014418 20 µM. Left, representative traces for control (DMSO, black) and treated neuron (AR-A014418, red). Note the reduction in the amplitude of the last spike. Right, plot of the spike attenuation (i.e., last spike/first spike) in control (DMSO, black) and treated (AR-A014418, red) neurons. Unpaired t test

