FIGURE 1 -.

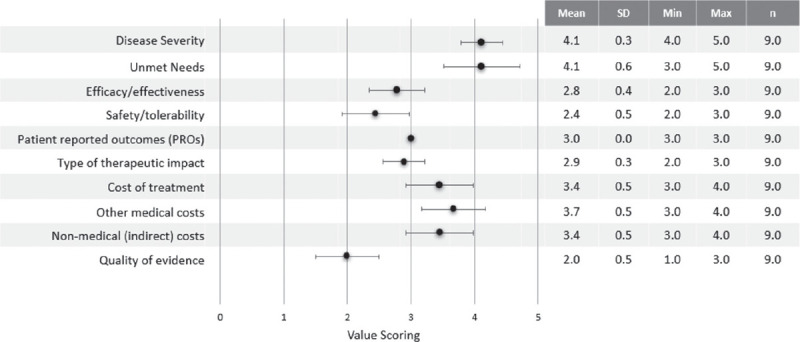
Quantitative criteria value scoring results. Min = minimum; Max = maximum; n = number of experts; SD = standard deviation. The black dots correspond to the mean of the scores.

Quantitative criteria value scoring results. Min = minimum; Max = maximum; n = number of experts; SD = standard deviation. The black dots correspond to the mean of the scores.