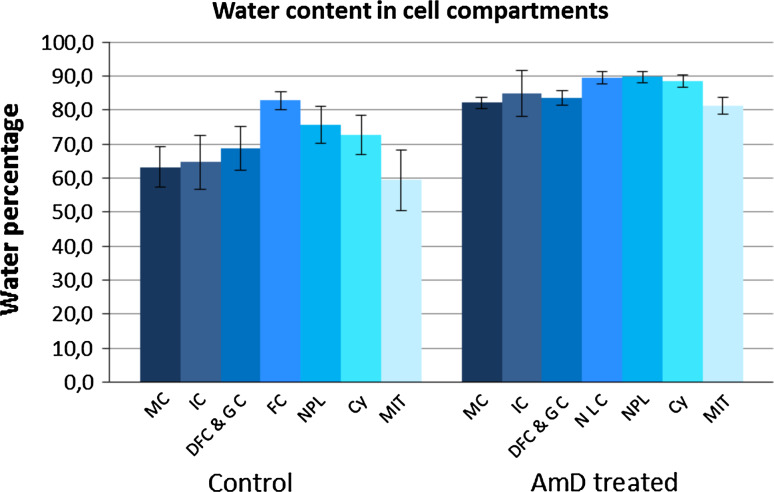
Fig. 2.
Water content was determined in control and actinomycin D-treated HeLa H2B-GFP cells. Quantification was performed for regions of interest in several compartments: MC (mitotic chromatin); IC (interphase chromatin); DFC/GC (nucleolar dense fibrillar component and granular component); FC/NLC (nucleolar fibrillar centers and nucleolar light caps); NPL (nucleoplasm); CY (cytosol); MIT (mitochondria). The data shown are mean ± SD from triplicate analyses (n = 80 and 25 for interphase and mitotic control cells, respectively; n = 33 and 5 for interphase and mitotic AMD-treated cells, respectively)

