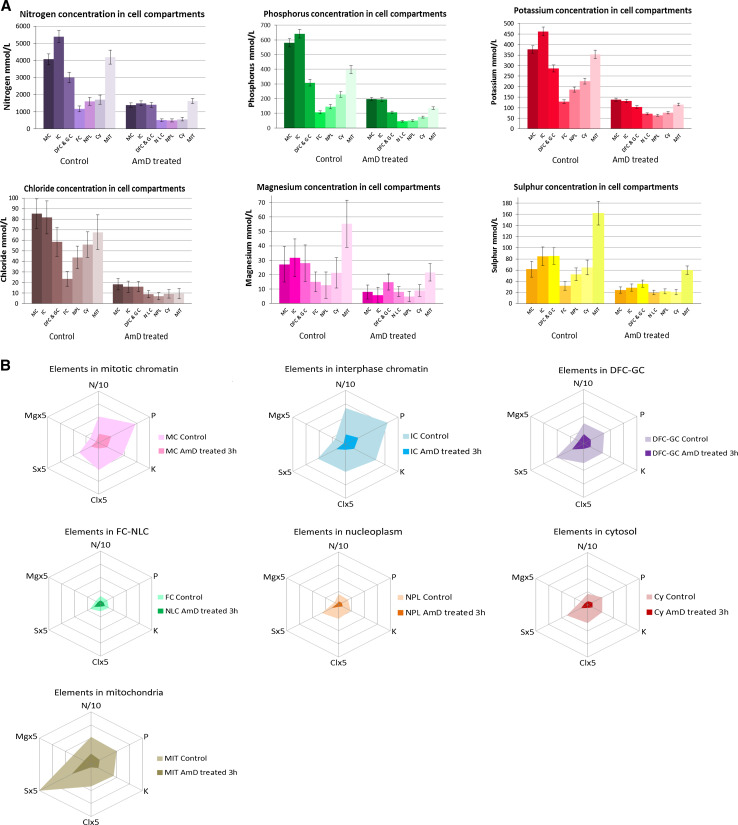
Fig. 3.
We identified several elements (C, O, N, P, S, K, Cl, Mg) and we quantified them by EDXS in control and actinomycin D-treated HeLa H2B-GFP cells. We analyzed regions of interest in several compartments: MC (mitotic chromatin); IC (interphase chromatin); DFC/GC (nucleolar dense fibrillar component and granular component); FC/NLC (nucleolar fibrillar centers and nucleolar light caps); NPL (nucleoplasm); CY (cytosol); MIT (mitochondria). The data are mean ± SD from triplicate analyses (n = 80 and 25 for interphase and mitotic control cells, respectively; n = 33 and 5 for interphase and mitotic AMD-treated cells, respectively). Data are presented: (1) as histograms (Fig. 3a), for comparison of the concentration of each element between compartments, (2) as spiderweb diagrams (Fig. 3b), to provide an “element descriptor” for each compartment

