
FIGURE 2.
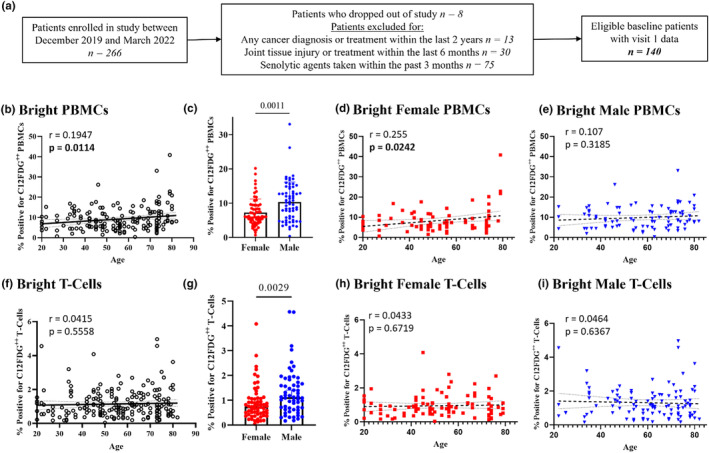
Percent C12FDG++ (bright) PBMCs increases with age and is elevated in age‐matched males compared to females. (a) Schematic of patient selection criteria and demographics (n = 168 visits). (b) Percent bright PBMCs significantly increases by 0.1947% per year of age and (c) were significantly elevated in males compared to females (n = 64/group, p = 0.0011). (d) Percent bright PBMCs of females significantly increases by 0.255% per year of age, while (e) percent bright PBMCs of males increases by 0.107% per year of age, but was not significantly correlated. (f) Bright TCs (n = 204 visits, p = 0.0029) were not significantly correlated with age but (g) were significantly elevated in males compared to females. (h, i) Percent bright TCs were not significantly correlated by either sex.