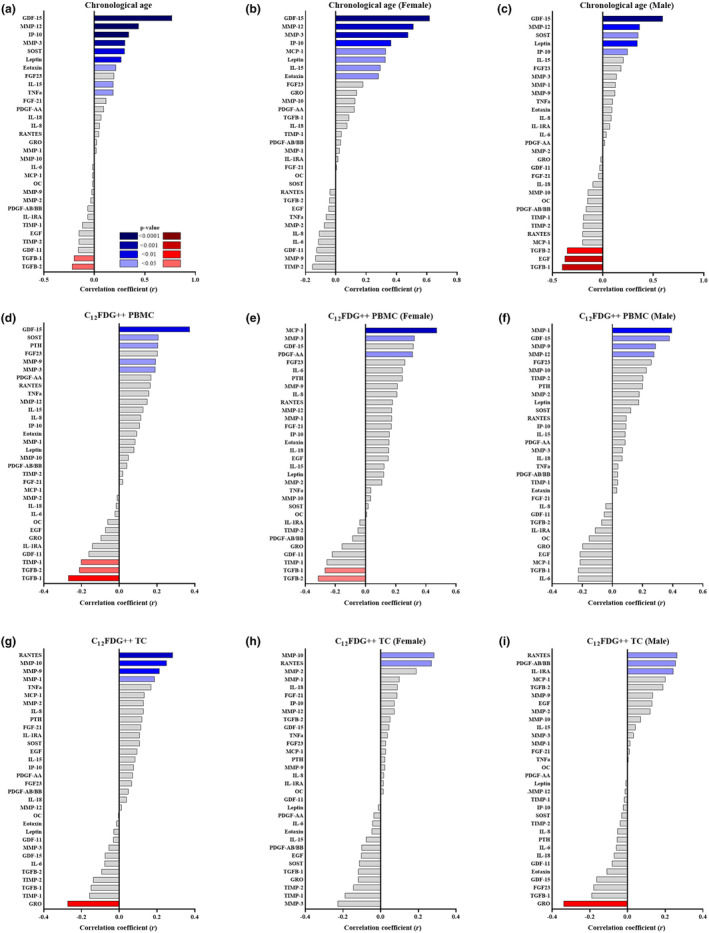
FIGURE 3.

Association of C12FDG++ with chronological age and senescence‐related serum biomarkers. Correlation tree showing association of various serum analytes with chronological age for the (a) total population, (b) females and (c) males. Correlation tree showing association of percent C12FDG++ (bright) PBMCs with various serum analytes for the (d) total population, (e) females, and (f) males. Correlation tree showing association of percent C12FDG++ (bright) TCs with various serum analytes for the (g) total population, (h) females, and (i) males. FDR‐corrected two‐sided Spearman correlation with significant p‐values colored blue (positive correlation) and red (negative correlation) as indicated in the ledged (n = 144).
