FIGURE 4.

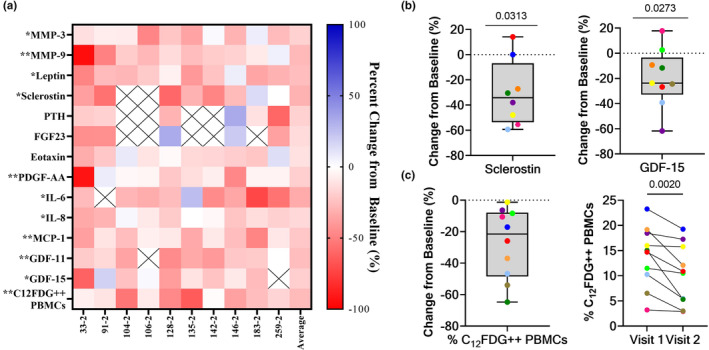
Longitudinal reduction of C12FDG++ PBMCs and associated serum biomarkers in patients reporting taking fisetin. (a) Heat map of percent change in aging and senescence‐associated serum biomarkers and % C12FDG++ (bright) PBMCs in patients reported taking fisetin compared to baseline (n = 10; days on drug = 58 ± 31; age = 70 ± 13 years; 6 M/4F). Significant differences are denoted by * (<0.05) and ** (<0.01). (b) Percent change from baseline of the bone inhibitor sclerostin (left) and the aging marker GDF15 (right) in participants reporting taking the senolytic drug fisetin (100 mg/day) compared to baseline (no fisetin) between two visits (n = 8–9). (c) Percent change (left) and absolute change (right) of % C12FDG++ (bright) PBMCs in participants following fisetin usage (n = 10). Significance determined using Wilcoxon matched pairs signed rank testing. Comprehensive summary of all changes in analytes not correlated with C12FDG++ PBMCs are listed in Figure S3.
