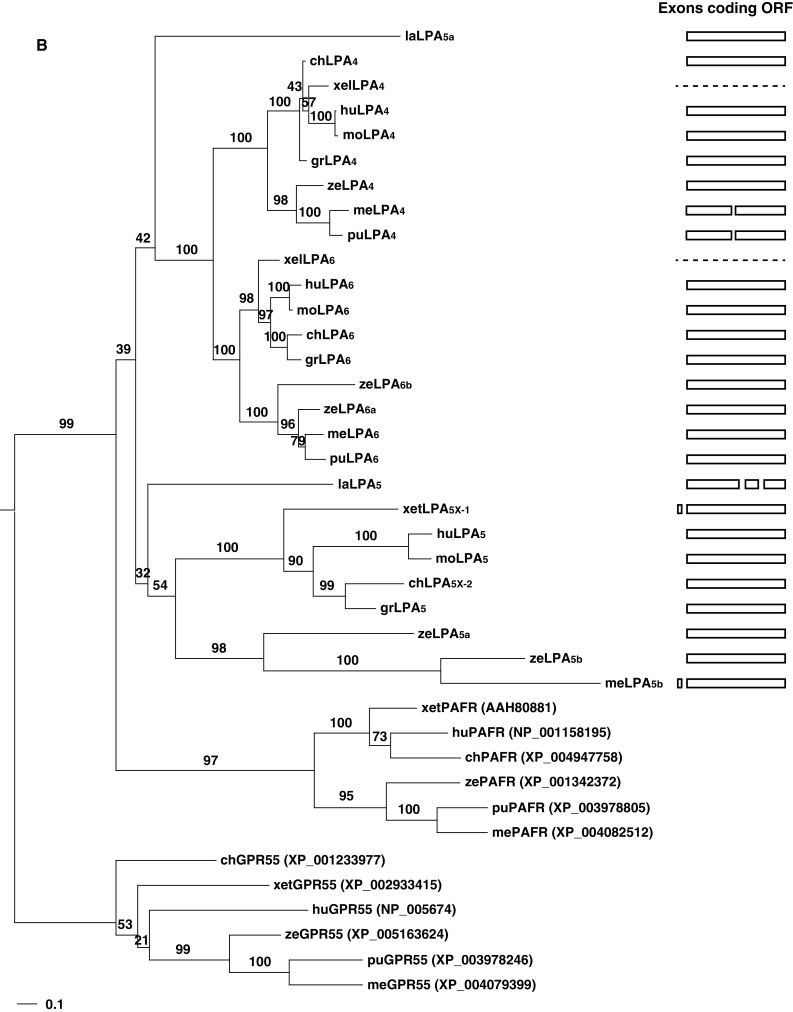
Fig. 3.


Phylogenetic trees and gene structures of the edg (a) and non-edg LPA receptors (b). For each family, closest outgroups [S1P receptors, GPR55, and platelet-activating factor receptors (PAFR)] were selected based on a preceding analysis by Yanagida and Ishii [69] using human LPA receptor genes. The amino acid sequences of LPA receptors of various vertebrates were aligned by MAFFT [70] with the auto option. The resulting alignments were subjected to PhyML [71] to infer phylogenetic trees based on the maximum likelihood (ML) method assuming the WAG [72] plus discrete Gamma model with four rate categories [73]. The GenBank accession numbers and EMBL protein ID numbers for the LPA receptors used in this analysis are shown in Table 1. The GenBank accession numbers for S1P receptors, GPR55, and PAFRs are shown in the parenthesis on the right of the receptor names. Bootstrap values are indicated at each node of the tree. On the right, each exon corresponding to the open reading frame is illustrated as a box. Dashed lines indicate no information for gene structures existing in the database. la lamprey, me medaka, pu pufferfish, ze zebrafish, xel Xenopus lavies, xet X. tropicalis, gr green sea turtle, mo mouse, hu human
