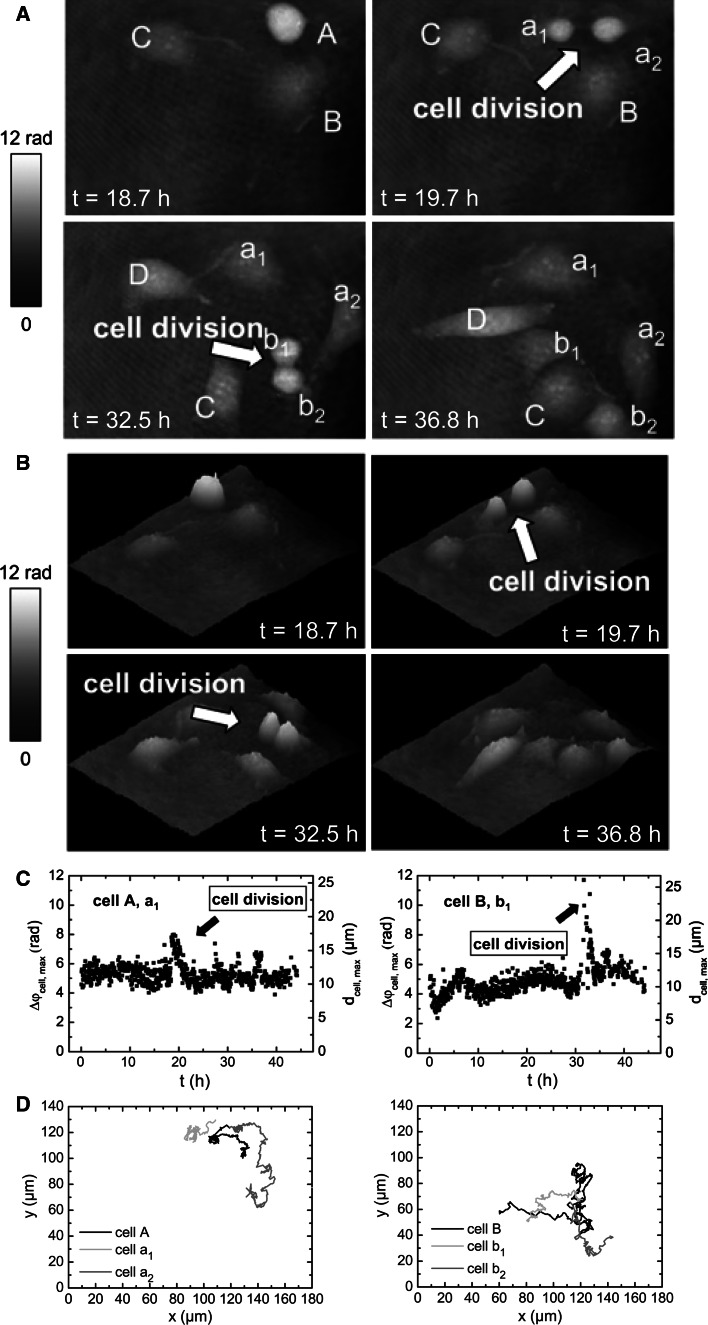
Fig. 3.
Digital holographic microscopy of a growing HBMEC monolayer. A defined region of the cell culture was selected for long-term investigation. a Gray-level-coded quantitative DHM phase contrast images and b pseudo 3D representation of the phase images. c Maximum phase contrast Δϕcell,max and corresponding maximum cell thickness d cell,max. d Two-dimensional tracking of the cells obtained from contrast images. The arrows indicate cell division after t = 19.7 h (cell A) and t = 32.5 h (cell B). The daughter cells of cell A and cell B are denoted as a1 and a 2 for cell A and b 1 and b 2 for cell B. The parameters Δϕ and d denote phase contrast in radian and corresponding cell thickness, respectively, for a cellular refractive index of 1.37. Two-dimensional trajectories indicate movement of cells A and B and the corresponding daughter cells after cell division. For details, see original article of Kemper et al. [152]. Compilation of four original figures, reprinted with permission from Kemper et al. [152], copyright Society of Photo-Optical Instrumentation Engineers 2010

