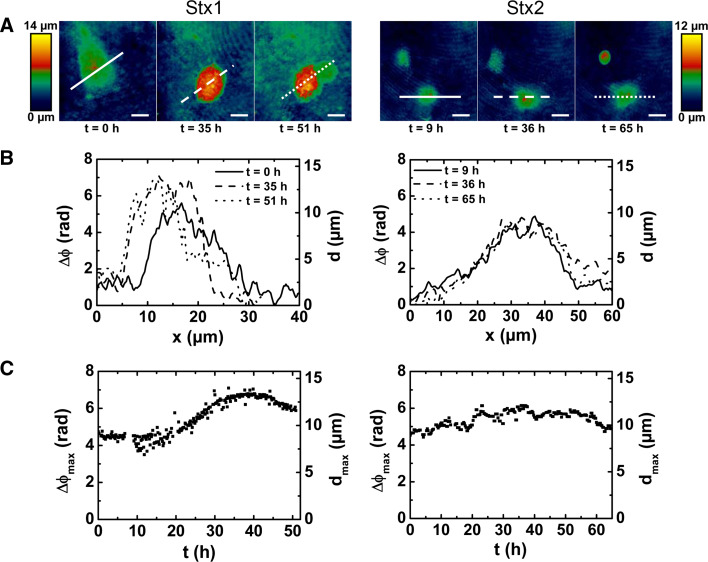
Fig. 4.
Digital holographic microscopy of the dynamic changes of Stx1- and Stx2-induced cell death of single HBMECs. Cells were grown to subconfluence, exposed to 500 ng/ml of Stx1 (left) or 500 ng/ml of Stx2 (right), and single cells were selected for long-term investigation. a False color-coded quantitative digital holographic phase contrast images of cells at indicated time after Stx addition. Bars 10 μm. b Cross-sections through the quantitative holographic phase contrast digital images whereby the x-axes match the lines in a. The parameters Δϕ and d denote phase contrast in radian and corresponding cell thickness, respectively, for a cellular refractive index of 1.37. c Temporal dependence of the maximum optical path length Δϕ max and the corresponding maximum cell thickness d max. Three independent single cell analyses were performed for each cell type with each toxin (500 ng/ml), and representative measurements are shown. For details, see original article of Bauwens et al. [146]. Reprinted with permission from Bauwens et al. [146], copyright 2010 Schattauer

