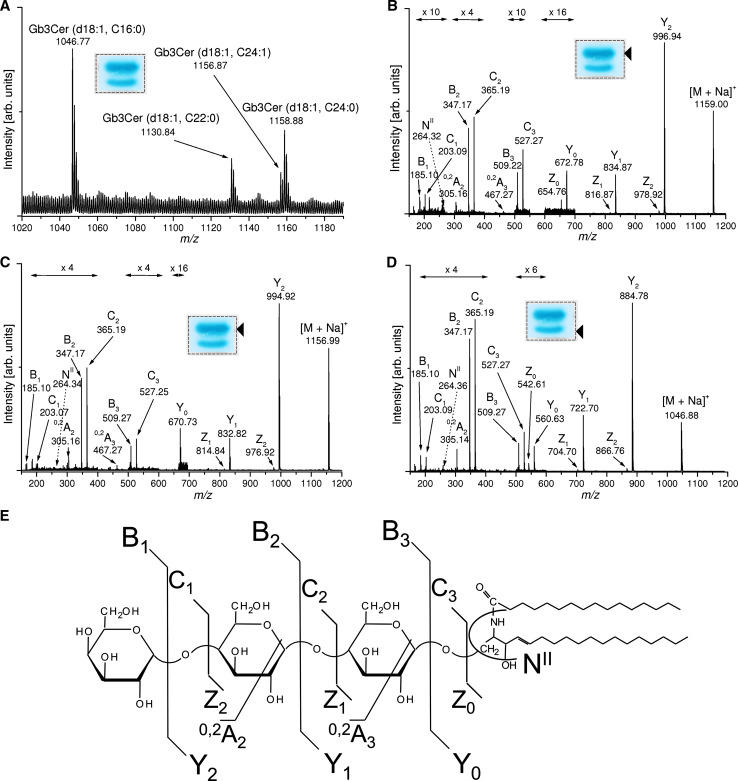
Fig. 7.
ESI–Q-TOF MS1 and MS2 spectra of antibody-detected Gb3Cer species from GMVECs. a MS1 spectrum. The spectrum was obtained from pooled silica gel extracts of four TLC overlay assays corresponding to 2 × 10⁵ cells. A representative overlay assay performed with a lipid extract from 5 × 10⁴ cells is shown in the inset whereby the framed dotted rectangle indicates the areas from which the silica gel was scraped off. b–d MS2 spectra. The arrowheads denote the positions of immunoreactive Gb3Cer lipoforms selected for MS2 analysis. A synopsis of the m/z values of [M+Na]+ ions obtained from TLC immunodetected Gb3Cer and Gb4Cer as well as their proposed structures are provided in Table 1. e Molecular structure and auxiliary fragmentation scheme of Gb3Cer (d18:1, C16:0)

