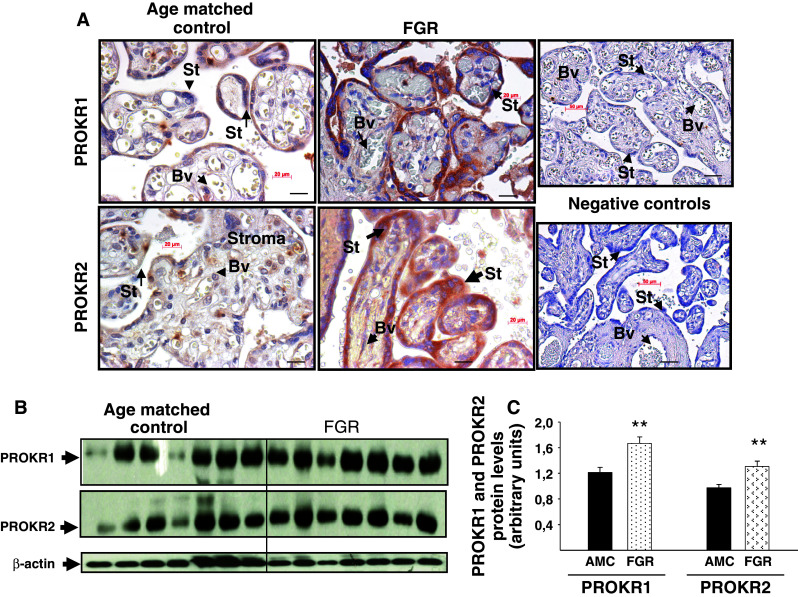
Fig. 8.

PROKR1 and PROKR2 protein expression in placental tissue from AMC and FGR pregnancies. a Representative photographs of PROKR1 and PROKR2 staining in AMC and FGR placentas. b Representative Western blots of PROKR1 and PROKR2 expression in AMC and FGR (14 AMC and 14 FGR). Standardization of the protein signals was done using beta actin. Quantification of the intensity of the bands is illustrated in c. Data represent the mean ± SEM of triplicate *p < 0.05 versus control. Ct cytotrophoblast, St syncytiotrophoblast, Bv blood vessel
