Fig. 2.
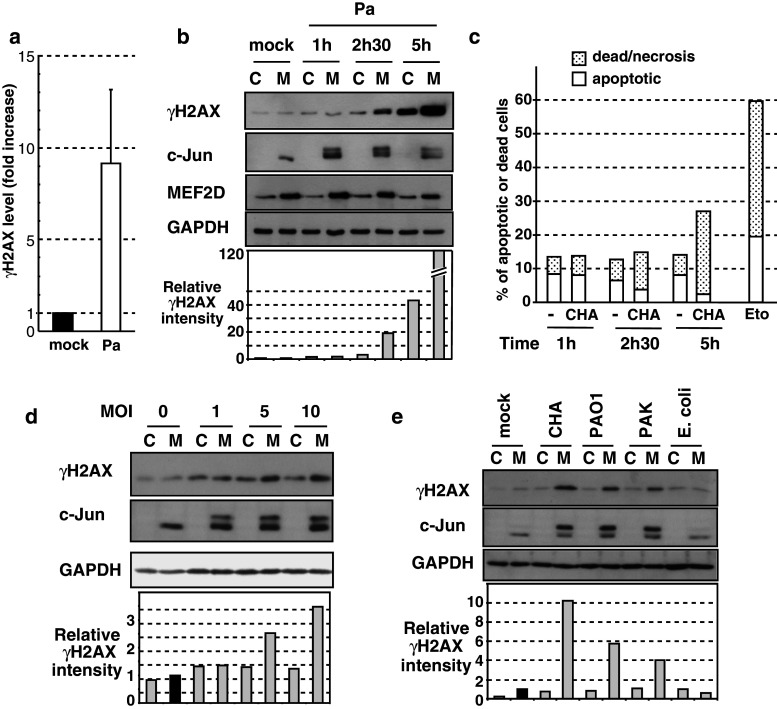
P. aeruginosa induces H2AX phosphorylation. a HL60 macrophages were infected (Pa) or not (mock) with P. aeruginosa CHA strain at a MOI of 10 for 2.5 h. Cell extracts were analyzed by Western blot with γH2AX-specific antibody (as shown in Fig. 2b) and quantified. γH2AX relative intensity normalized to GAPDH level was set to 1 (dark bar) in mock macrophages for panel a, b, d, and e. Data were expressed as fold over mock macrophages. The results represented the mean ± SD of seven independent experiments. b Undifferentiated HL60 cells (C) or HL60 macrophages (M) were infected with P. aeruginosa CHA strain (Pa) at a MOI of 10. Cell extracts were prepared at the indicated times post-infection and analyzed by Western blot with the indicated antibodies. γH2AX relative intensity was determined as above. c Measurement of cell death and cell apoptosis by flow cytometry (40,000 cells analyzed for each point) after infection by P. aeruginosa CHA. Apoptotic cells are annexin-positive and propidium iodide-negative; dead or necrotic cells are both positive for annexin and propidium iodide. Etoposide (Eto, 10 μM for 18 h), an antitumor drug that causes DNA damage, was used as a positive control. d Undifferentiated HL60 control cells (C) or HL60 macrophages (M) were infected at MOI of 1, 5, and 10 or mock treated. Analysis by Western blot of cell extracts prepared 2.5 h after the infection. e Cells were infected as above with various strains of P. aeruginosa (CHA, PAO1, and PAK) or with an E. coli laboratory strain derived from K12, all at a MOI of 10. Extracts were analyzed by Western blot

