
Fig. 4.
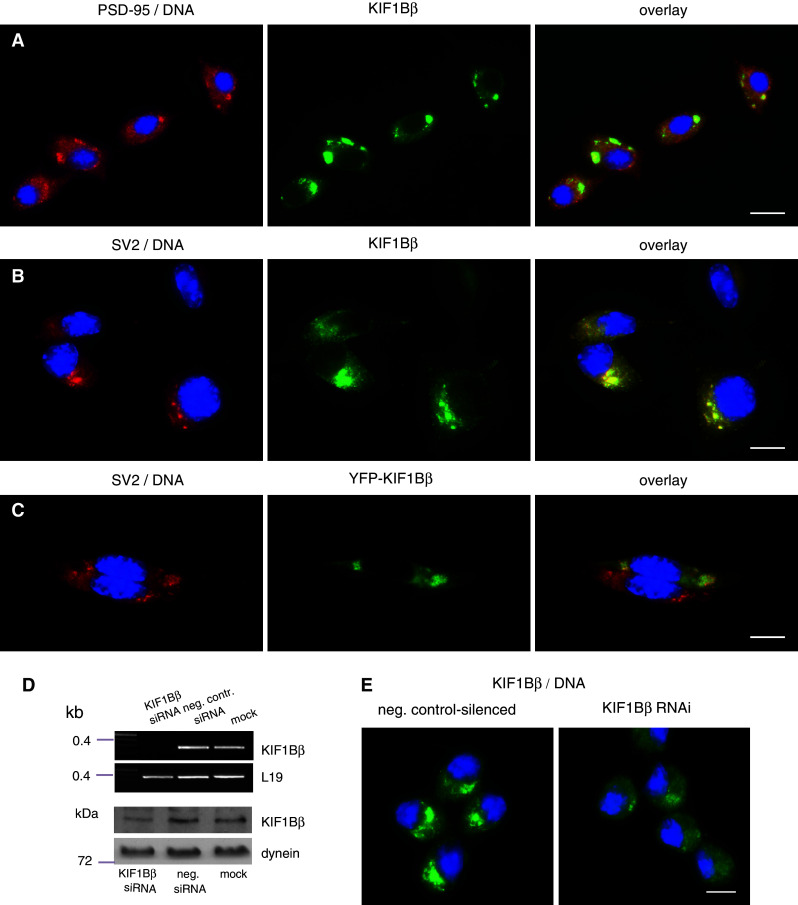
Intracellular localization of KIF1Bβ in mouse neuroblastoma NSC-34 cell line. NSC-34 cells stained with antibodies to a PSD-95 (red), b SV2 (red), with concurrent labeling of nuclei with Hoechst 33342 (blue). Green panels represent labeling with anti-KIF1Bβ. Scale bars (a) 20 μm, (b, c) 10 μm. c NSC-34, transiently transfected with pEYFP-KIF1Bβ, green). Anti-SV2 staining is in red, and DNA in blue. Of the two cells in the field, only the top cell is transfected: YFP-KIF1Bβ localization (green) overlaps extensively with that of SV2 (red), therefore merging to yellow in the overlay. Scale bar 10 μm. d Quantification of silencing efficiency by RT semi-quantitative PCR and immunoblot. Top two panels levels of KIF1Bβ mRNA at 120 h post-transfection in NSC-34 cells silenced with 320 pM of KIF1Bβ-specific siRNA cocktail are compared to control-silenced cells (negative control) and to mock-treated cells (no siRNA). RT-PCR detection of L19 mRNA levels serves as internal control. Bottom two panels KIF1Bβ protein levels are compared in corresponding samples. Detection of the intermediate chain of dynein serves as loading control in the three samples. e KIF1Bβ immunofluorescence in silenced cells versus negative control-silenced cells. NSC-34 cells were immunostained for KIF1Bβ (green) and counterstained for DNA (blue). KIF1Bβ-silenced cells display a marked reduction in the signal of KIF1Bβ-positive vesicular structures when imaged at the same exposure as negative control-silenced cells. Scale bar 10 μm