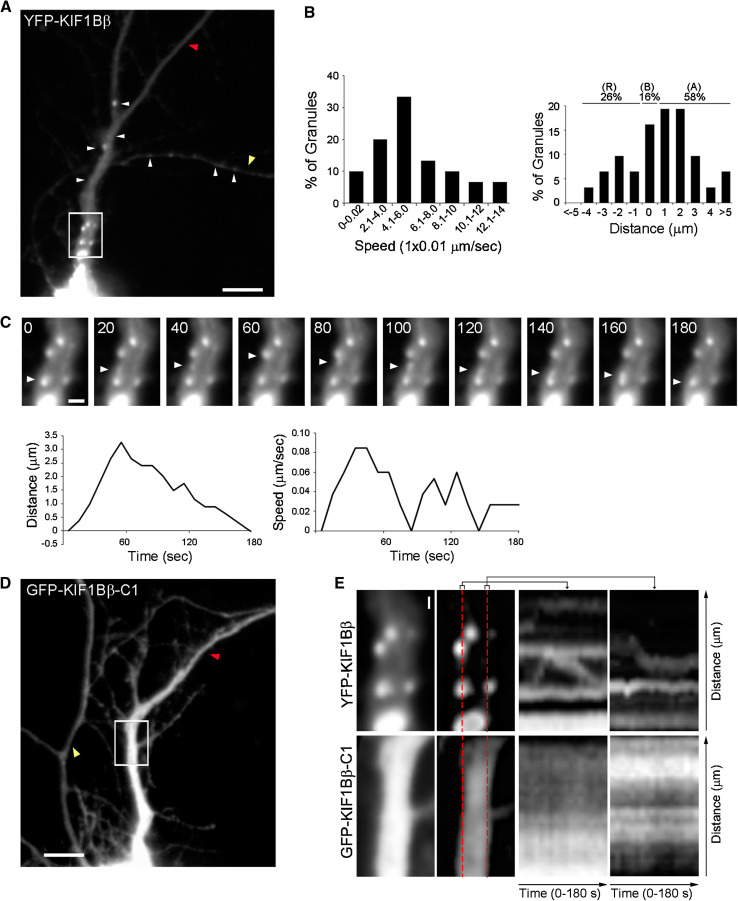
Fig. 9.
Processive movement of YFP-KIF1Bβ granules in the dendrites of living cortical neurons. a Example of a mouse cultured cortical neuron transfected with plasmid pEYFP-KIF1Bβ (full-length construct in Fig. 7c), showing fluorescent granules. The dendrite in this cell is indicated with a red arrowhead and the axon with a yellow arrowhead. Scale bar 10 μm. b Histogram of the maximum speed of 30 granules (average ± SD: 0.060 ± 0.034 μm/s) (left panel); final distances these 30 granules covered in 180 s (average ± SD: 0.9 ± 2.7 μm) (right panel). c Upper panels a series of still images, taken at 20-s intervals, from a time-lapse movie of the rectangular area marked in (a), as an example of the movement of a granule (arrowheads) for a period of 180 s. Scale bar 2 μm. The full video of this sequence is given as an Online Resource video1. (The full video of a sequence derived from a neuron transfected with pEGFP-KIF1Bβ-C1 is given as an Online Resource video2). Bottom panels time course, during 180 s, of the distances covered by this representative granule from the start point, as traced by the arrowheads (upper panels). Corresponding time course of the speeds of the sample granule during the 180 s recording (right panel). d Equivalent example of cortical neuron transfected with pEGFP-KIF1Bβ-C1 (motor-less construct “C1” in Fig. 7c), showing diffuse fluorescent labeling. The dendrite in this cell is indicated with a red arrowhead and the axon with a yellow arrowhead. e Kymographs of neurons transfected with pEYFP-KIF1Bβ or pEGFP-KIF1Bβ-C1. Rectangular areas marked in (a) and (d) indicate, respectively, the region selected to generate the kymographs. Red dashed lines indicate the orthogonal plane represented by the kymographs. Scale bar 1 μm

