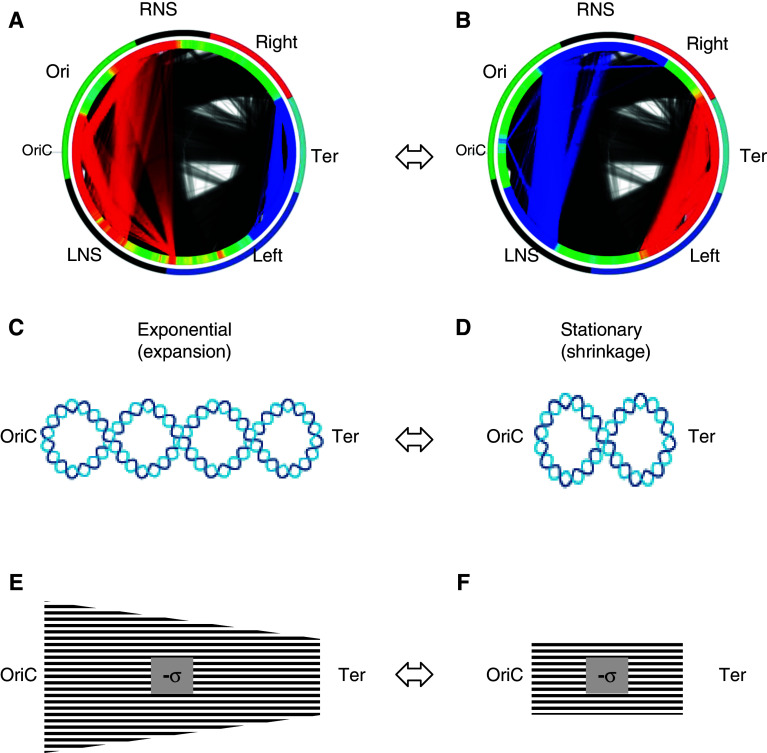
Fig. 5.
Changes of the E. coli chromosome morphology, the supercoiling gradient and intra-chromosomal communications during the growth cycle. a, b The outer circle shows chromosomal macrodomains coded in colors: Ori green, Right red, Ter light blue, Left blue. The left (LNS) and right (RNS) non-structured domains are indicated in black. The second circle shows increased (red) and decreased (blue) chromosomal density distributions of the expressed genes during exponential growth (a) and on transition to stationary phase (b). The connecting lines inside the circles accordingly indicate increased (red) and decreased (blue) communications between the chromosomal domains harboring functionally related genes [29, 30]. The origin (OriC) and terminus (Ter) of chromosomal replication are indicated. c, d The changes of the bacterial chromosome morphology. The chromosome is depicted as a simple plectoneme with interwound arms aligned along the OriC–Ter axis. Decrease of the overall superhelicity (indicated by reduction of crossings) and shrinkage along the OriC to Ter axis occur during transition from exponential (c) to stationary phase (d) (Mircea Petrescu and G.M., in preparation). e The proposed spatial gradient of DNA negative superhelical density (-σ) extending along the OriC–Ter axis during the exponential phase, and f the flattening of gradient (indicated by change of shape) on transition to stationary phase. In principle, the level of superhelicity assumed in stationary phase need not correspond to the lowest level in exponential phase

