Fig. 2.
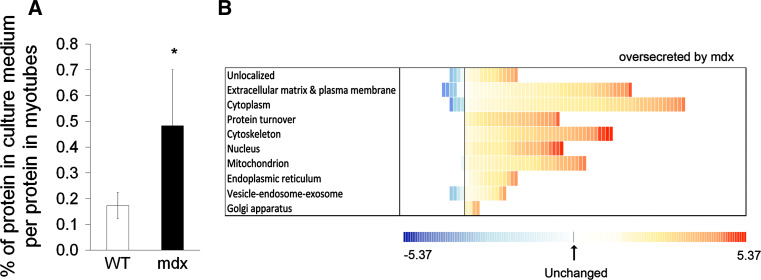
Mdx myotubes show greater protein release in vitro. a Protein quantity released into the culture medium. Values are expressed as a percentage of total cellular protein (n = 5/group). *p < 0.05, mdx vs. wild-type H-2K myotubes. b Distribution of proteins from mdx and wild-type myotubes differentially released into the culture medium. Proteins were sorted according to their known cellular localizations as attributed by the DAVID functional annotation software. Each square represents a protein. The value of the fold change is color-coded: red being over-secreted by mdx myotubes (maximum being at 5.37-fold) and blue under-secreted (minimum at −5.37-fold). See Suppl Table 1 for more details

