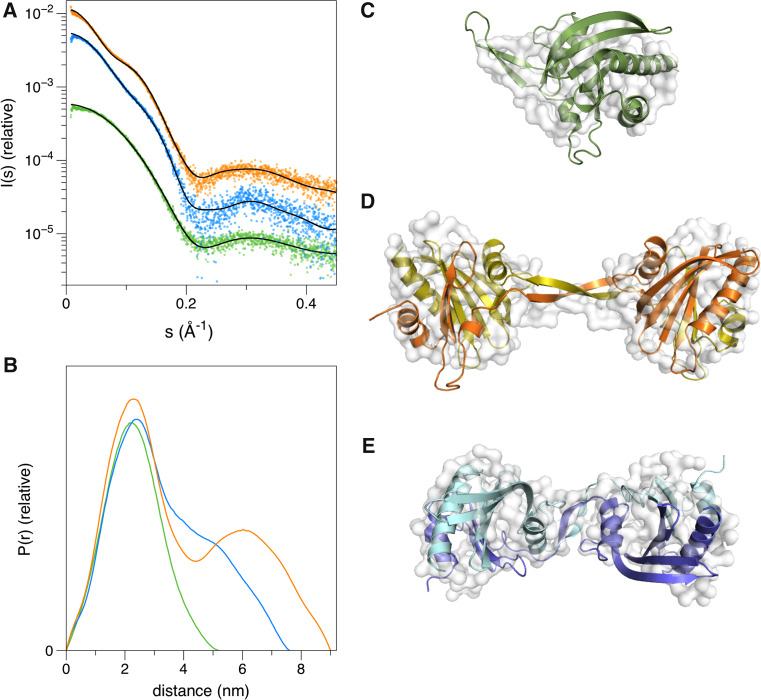
Fig. 2.
Solution structures of the wild-type and mutant profilins. a SAXS curves and fits of the crystal structures (wild-type, Δ6)/model (Δ10) to the data. b Distance distribution curves. c–e SAXS models (white surface) calculated using GASBOR and fits of the crystal structures/model (colored cartoon representation) in them. Coloring in all panels follows that of Fig. 1

