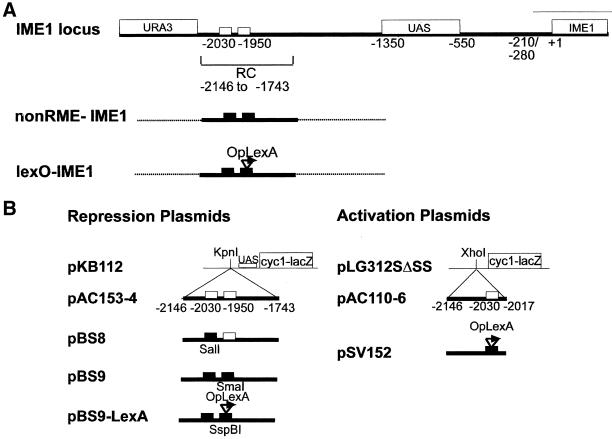
Figure 1.
Schematic of structural modifications of the IME1 upstream region (A) and plasmids used in this study (B). The diagram shows Rme1p binding sites, the UAS, IME1, and URA3 coding regions (labeled rectangles), and RNA start sites (−280 to −210). Small white rectangles indicate the Rme1 binding sites. Small black rectangles indicate the mutations in the Rme1 binding sites. Arrow indicates the lexA operator. End points are numbered with respect to the IME1 translation start.

