Fig. 5.
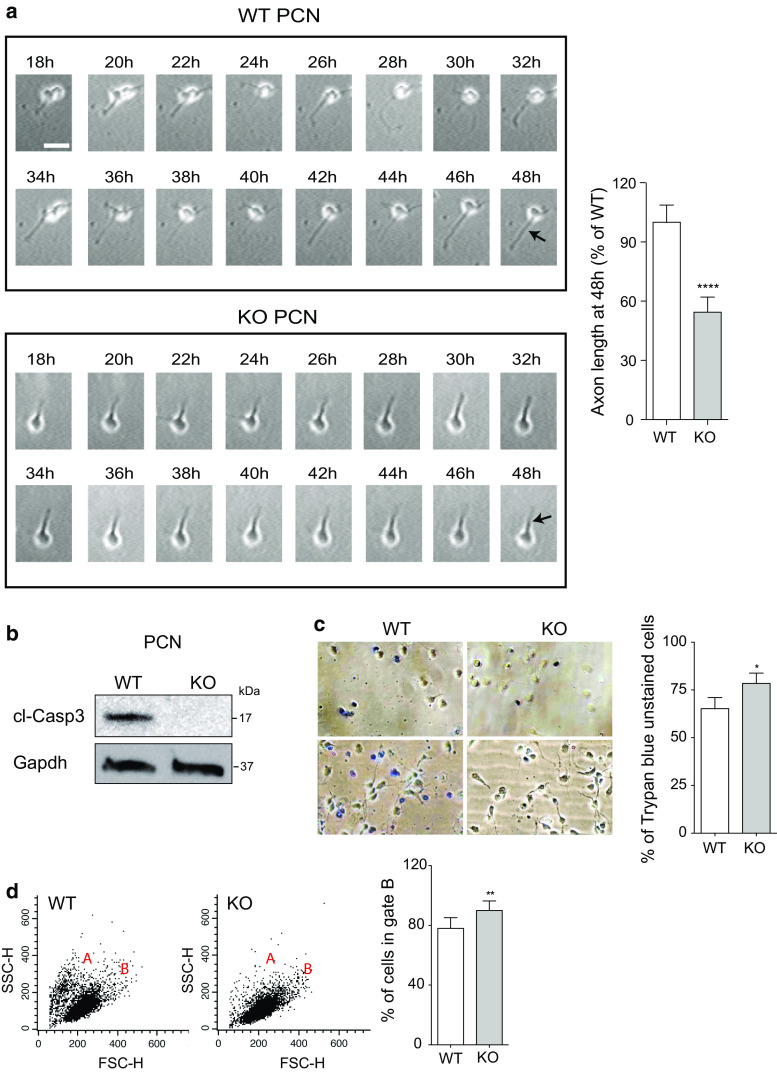
Slow axonal growth and reduced cell death in Apaf1-KO PCN. a Time-lapse analysis of PCN isolated from E13.5 WT and Apaf1-KO mice embryos and seeded at the same density was performed. 30 single neurons for each genotype were recorded in three independent experiments, one representative example for each genotype being reported. The axon elongation was recorded starting from 18 h after plating (18 h) and followed for 30 h (48 h), as indicated by the arrows. Scale bar represents 50 μm. Determination of the axon length of isolated KO neurons with respect to the WT ones performed at 48 h after plating is shown as the mean ± SEM; n = 30, ****P ≤ 0.001 with respect to WT. b WT and KO PCN at 2 DIV were assayed for cleaved Caspase3 (cl-Casp3) protein levels, and Gapdh was used as loading control. c WT and KO PCN at 2 DIV were stained with Trypan blue and unstained cells were counted and shown as percentage of total cells. At least 2000 cells, in three independent experiments, were counted for each genotype. d Flow cytometric analysis of WT and KO PCN at 2 DIV. Dot plots show cell size (x axis) and granulosity (y axis) which allow identification of living cells (population B). The percentage of cells in population B with respect to the total number of cells analyzed is shown. *P ≤ 0.05, **P ≤ 0.01 with respect to WT

