Fig. 3.
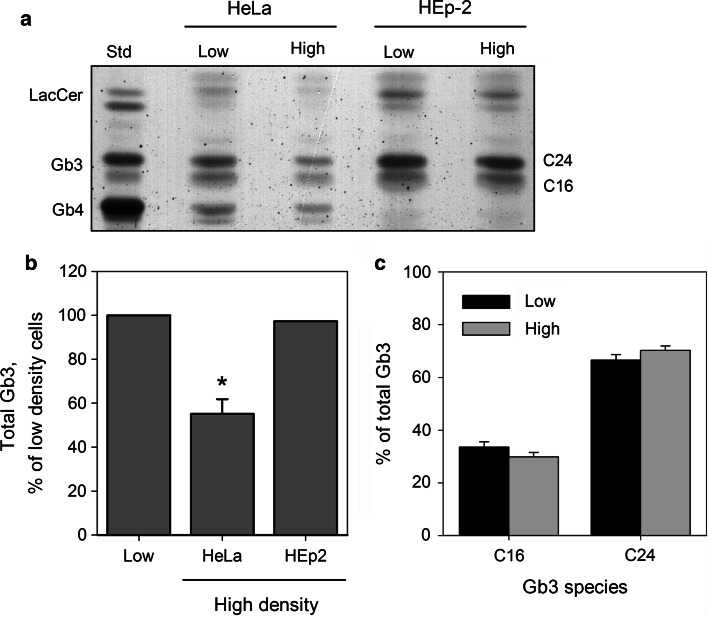
The Gb3 content is reduced in high density HeLa but not in HEp-2 cells. Glycosphingolipids were extracted from low and high density HeLa and Hep-2 cells with chloroform/methanol as described in “Materials and methods ”. Samples were then dried, resuspended in 1 M NaOH, dialyzed against water and dried again. Finally, samples were resuspended in 2:1 (v/v) chloroform:methanol, applied on a silica plate and chromatographed. The bands were visualized by orcinol staining and scanned for intensity quantification. a A representative chromatogram is shown. Gb3 separated into two bands, C16 and C24, which were named according to the number of carbon atoms in the fatty acyl chains of major Gb3 species present in each band. b Quantification of Gb3 content in HeLa and HEp-2 cells. For plotting, band intensity values were normalized to low density samples. For HeLa cells, the experiment was performed four times, and the graph shows mean value + SEM; *p < 0.01, paired Student’s t test. The lipid extraction from HEp-2 cells was performed once, and the bar shows the mean value of two separate chromatographic analyzes performed on the extract. c Quantification of major Gb3 species in low and high density HeLa cells, n = 4

