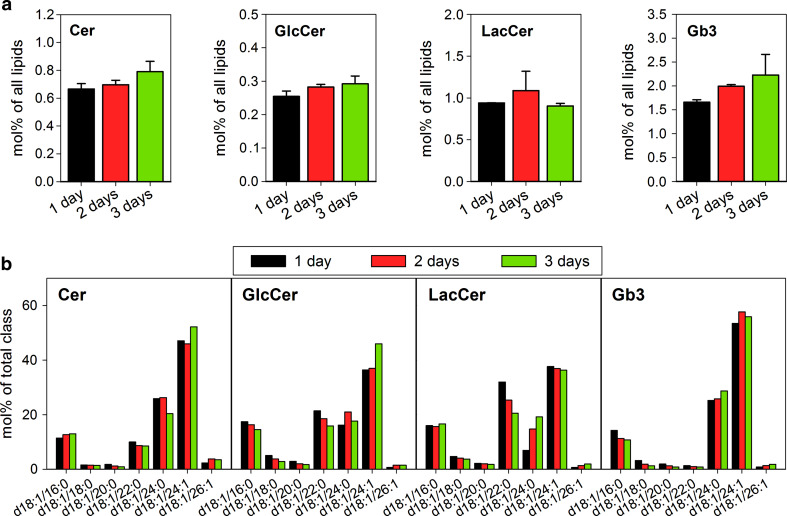
Fig. 4.
The content and species composition of Cer, GlcCer, LacCer and Gb3 in HEp-2 cells. a The content of Cer, GlcCer, LacCer and Gb3 in the HEp-2 cells after 1, 2, and 3 days growth in the culture. Data are normalized to the total lipid content detected for each time point. The error bars show the difference between the mean value and two independent biological replicas. b Species distribution of Cer, GlcCer, LacCer, and Gb3 in the HEp-2 cells after 1, 2, or 3 days growth in the culture. The content of each species is represented as a percentage of the total amount of the class

