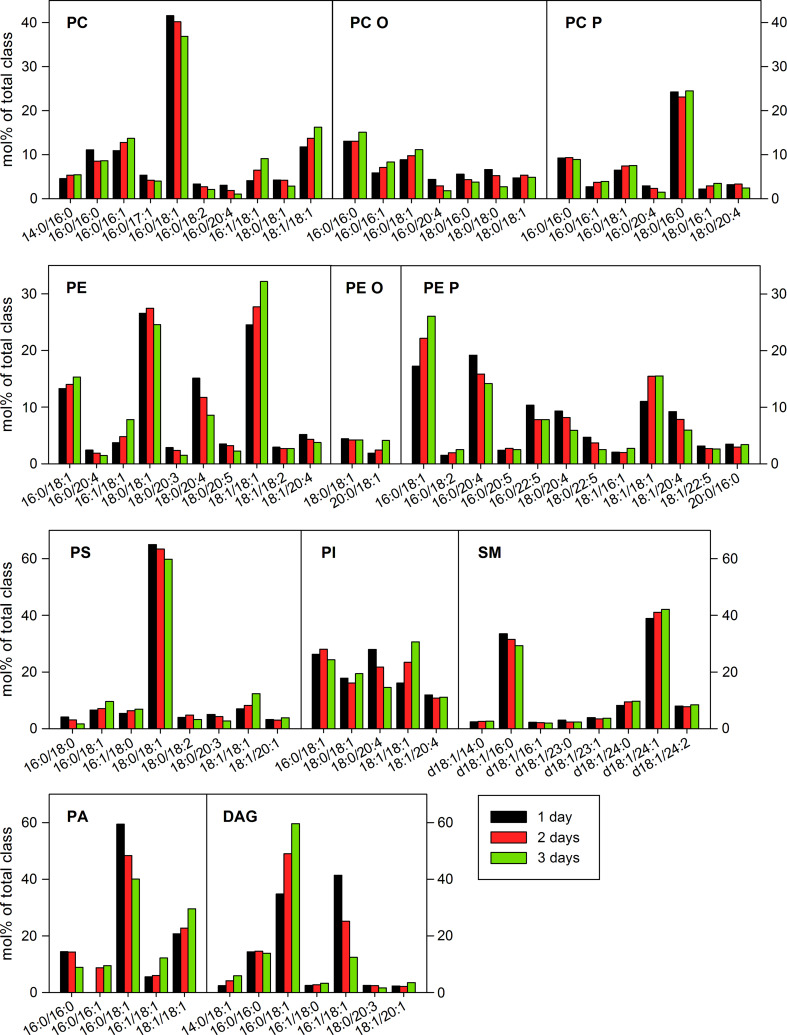
Fig. 6.
Species composition of major lipid classes in HEp-2 cells. Samples were collected 1, 2, or 3 days after HEp-2 cell seeding to culture plate dishes, and analyzed by MS/MS. The amount of individual lipid species was quantified as percentage of the total content of the lipid class. For clarity, minor species are not presented in the graph (for full species list and quantitative data, see Online supplementary material 2). A contamination of an isobaric alkyl species can exist for the PC P and PE P species

