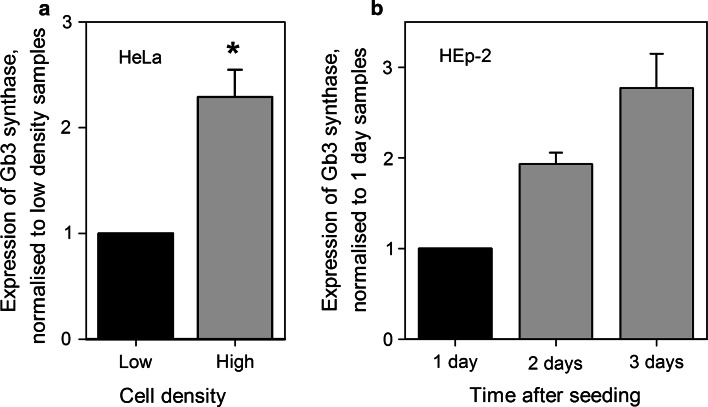
Fig. 8.
Gb3 synthase gene expression is up-regulated in high density cells. Total mRNA extracts from the cells were analyzed by qRT-PCR, and relative expression of the Gb3 synthase gene was quantified in the samples. TBP encoding gene was used as a reference for the quantification. a Expression of the Gb3 synthase gene in low and high density HeLa cells. For plotting, data were normalized to low density samples, and the graph represents mean values + SEM, n = 3, *p < 0.01, paired Student’s t test. b Expression of the Gb3 synthase gene in HEp-2 cells 1, 2, and 3 days after cell seeding. For plotting, data were normlized to 1-day samples, and the graph represents mean values of two independent experiments. The error bars show the difference between the mean value and values of the two experiments

