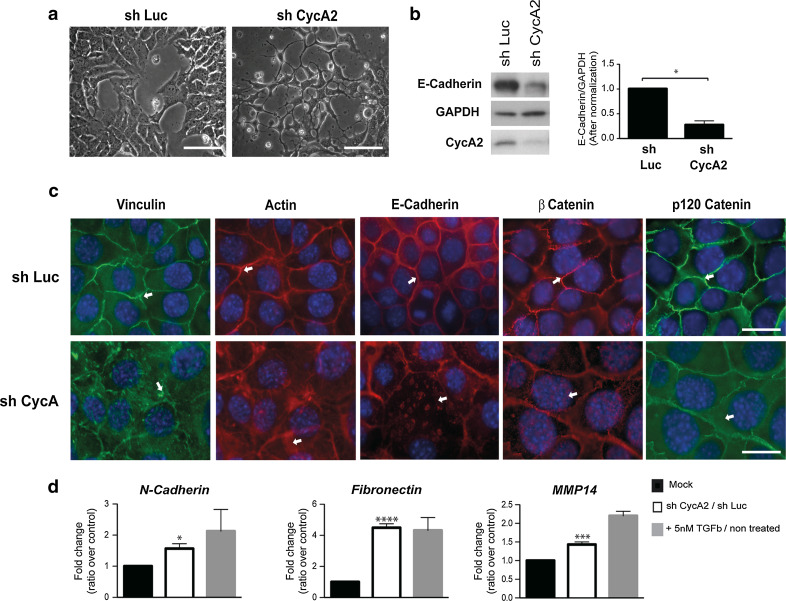
Fig. 1.
Induction of mesenchymal traits following Cyclin A2 depletion in NMuMG cells. a Visualization of sh Luc and sh CycA2 NMuMG cells by light microscopy. Scale bar 200 μm. b Western blot analysis of E-Cadherin in Cyclin A2-depleted cells and sh Luc NMuMG cells. E-Cadherin expression was quantified by densitometry and normalized to that of GAPDH (n = 3, *P = 0.01). c Staining of F-Actin using Phalloidin-Rhodamine, β Catenin (red) or Vinculin (green), E-Cadherin (red) and p120 Catenin (green) in sh Luc and sh CycA2 NMuMG cells. Scale bar 20μm. d qPCR analysis of N-Cadherin, Fibronectin and MMP-14 mRNA levels. The values are expressed as fold change, where sh CycA2 was compared to sh Luc and TGFβ treated cells to untreated cells. Data are represented as mean ± SEM

