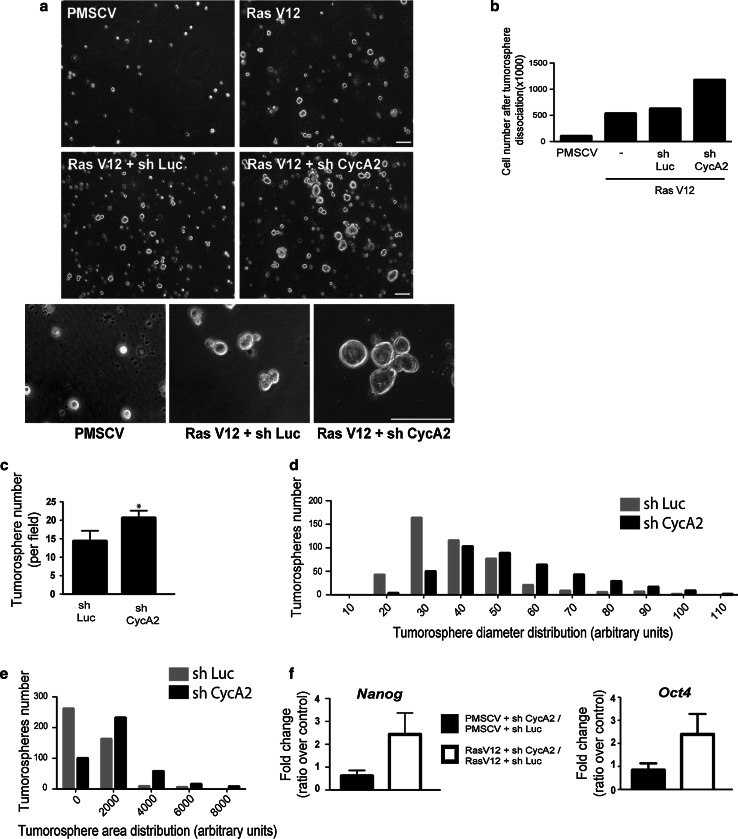
Fig. 5.
Cyclin A2 knockdown enhances tumorosphere formation in NMuMGRasV12 cells. a Visualization of tumorosphere formation by light microscopy in sh Luc and sh CycA2 NMuMGRasV12 cells. Scale bar 100 μM. b Cell numbers after dissociation of tumorospheres formed by cells expressing RasV12 with or without Cyclin A2 knockdown (n = 3, *P = 0.03). c Tumorosphere number, diameter (d) and area (e) represented as frequency distribution in NMuMGRasV12 Cyclin A2-depleted cells relative to cells expressing the sh Luc control (n = 3, ****P < 0.001). f mRNA levels of Nanog and Oct4 by qRT-PCR and expressed as fold change, where the level in sh CycA2 cells was normalized to sh Luc infected cells with or without RasV12 expression. Data are represented as mean ± SEM. ***P < 0.001

