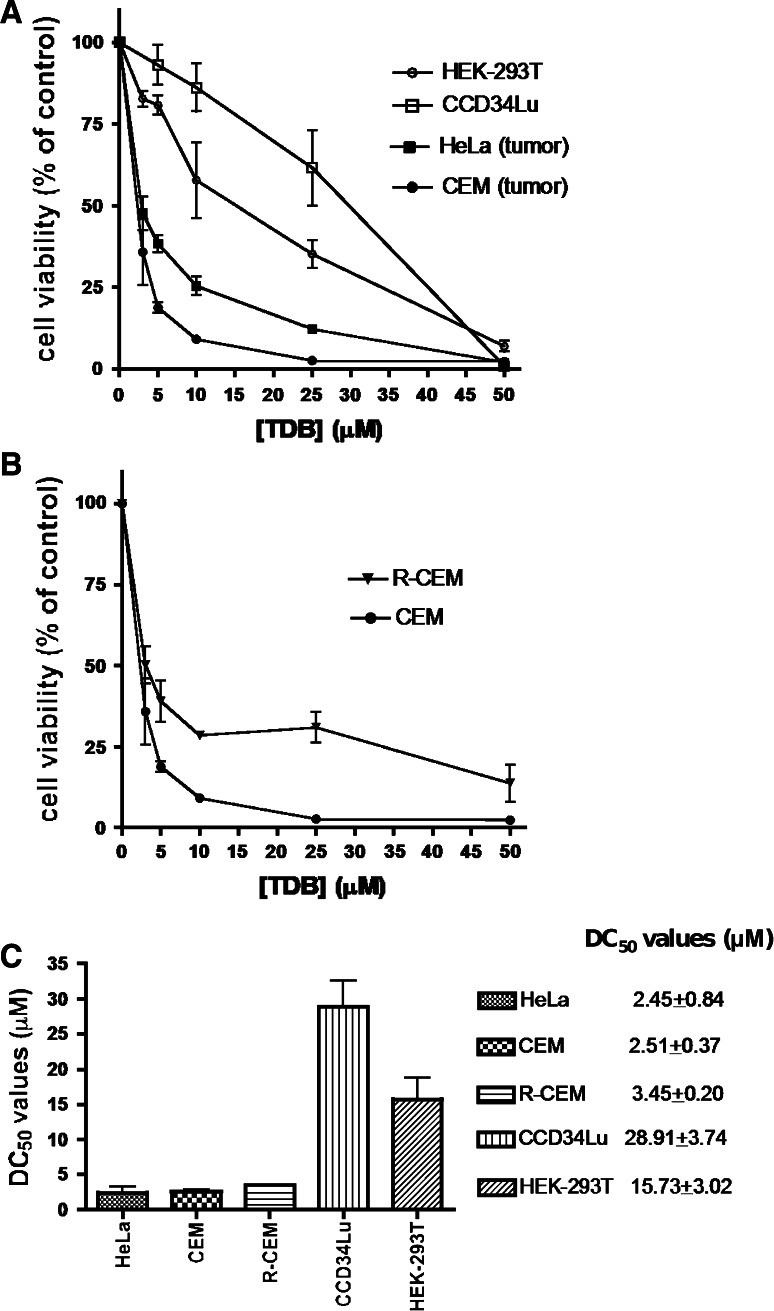
Fig. 7.
Sensitivity to TDB of different cell lines. Cell viability was measured by the MTT method after cell treatment for 24 h with increasing concentrations of TDB. 100 % cell viability was assigned to the vehicle-treated control cells. At least three experiments were performed for each cell line; mean ± SEM values are shown. a Comparison between tumor and non-tumor cell lines. b Comparison between a multidrug-resistant cell variant (R-CEM) and its parental line (CEM). c DC50 values indicate the TDB concentrations (±SEM), which induce 50 % of cell death in 24 h

