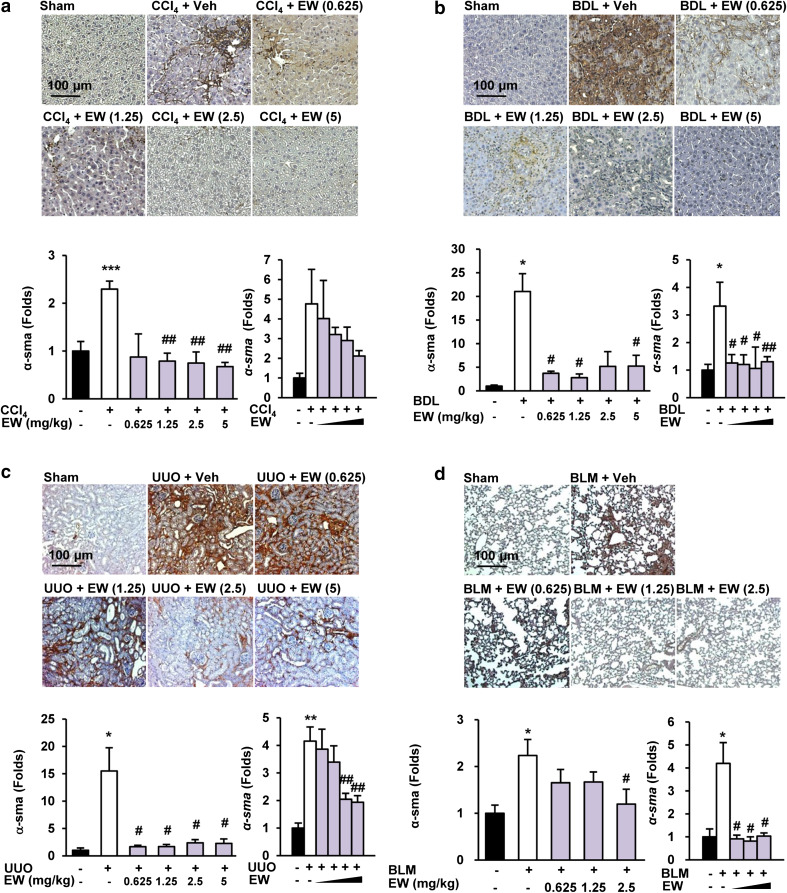
Fig. 2.
EW-7197 ameliorates the accumulation of α-SMA in fibrotic tissue. a–d IHC (upper), western blot (lower left), and qRT-PCR (lower right) analysis of α-SMA in liver tissues of CCl4 mice (a), BDL rats (b), UUO mice (c), and BLM mice (d). GAPDH was used as a reference. *p < 0.05 vs. Sham, **p < 0.01 vs. Sham, ***p < 0.001 vs. Sham, # p < 0.05 vs. Vehicle, ## p < 0.01 vs. Vehicle. Scale bars 100 μm

