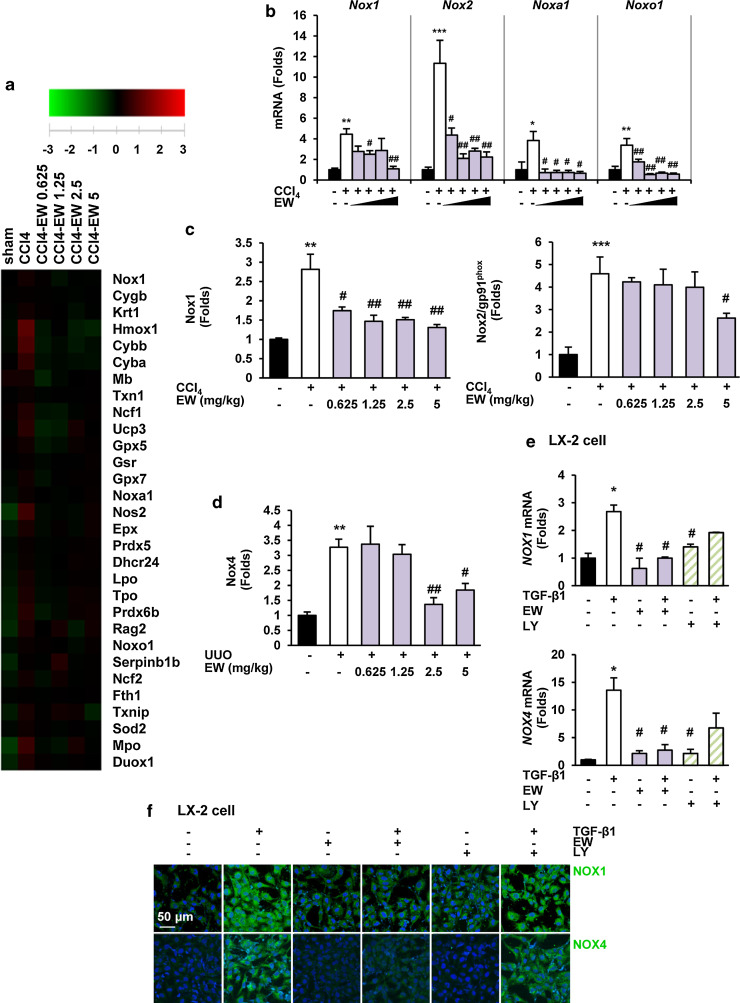
Fig. 7.
EW-7197 attenuates TGF-β-induced NOX expression. a Heat maps depicting mRNA expression of oxidative stress-related genes in liver tissues of CCl4 mice (n = 4). Gene expression levels are presented as the log2 ratio to the mean intensity and depicted as color variation from red (high expression) to green (low expression). b mRNA expression levels of NOXs and NOX components in liver tissues of CCl4 mice. c Densitometric analysis of western blots of NOX1 and NOX2 in liver tissues of CCl4 mice. d Densitometric analysis of western blots of NOX4 in kidney tissues of UUO mice. GAPDH was used as a reference. *p < 0.05 vs. Sham, **p < 0.01 vs. Sham, ***p < 0.001 vs. Sham, # p < 0.05 vs. Vehicle, ## p < 0.01 vs. Vehicle. e mRNA expression levels of NOX1 (upper) and NOX4 (lower) in LX-2 cells. LX-2 cells were treated with the indicated drugs in the presence or absence of TGF-β1 for 24 h. GAPDH was used as a reference. *p < 0.05 vs. untreated control, # p < 0.05 vs. TGF-β-treated control. f Immunofluorescence staining of NOX1 and NOX4 in LX-2 cells. Both NOX1 and NOX4 were stained with Alexa Flour 488 (green) and images were merged. Scale bars 50 μm

