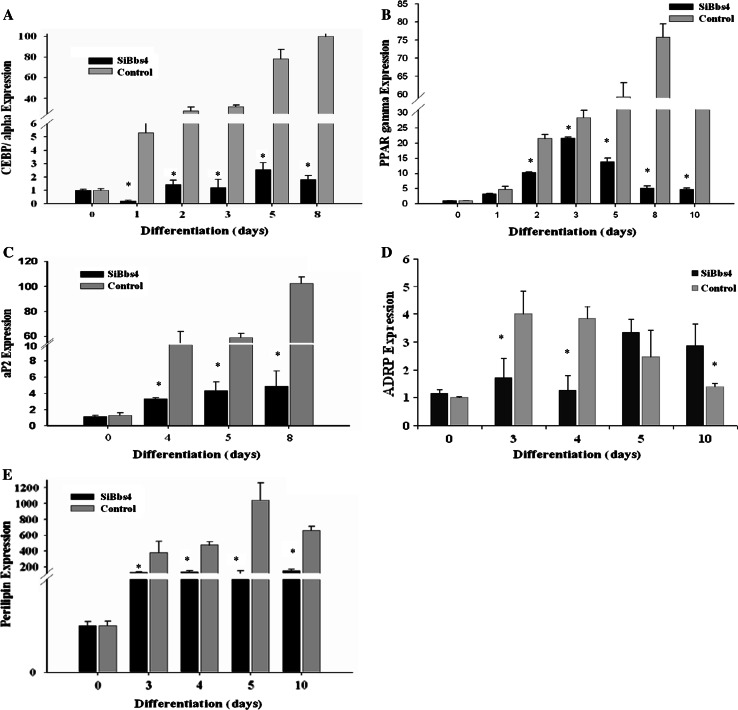
Fig. 2.
Adipogenic markers in Bbs4 silenced adipocytes during differentiation. Differentiation was induced in preadipocytes as described in materials and methods. Total RNA was isolated from cells at 1-day intervals throughout differentiation and subjected to QPCR. Statistical analysis of QPCR was carried out using the (2-ΔΔCt) method, calculating the change in mRNA levels relative to day 0, and is expressed as fold change. a C/ebpα b Pparγ c aP2 D. ADRP E. Perilipin. Results are expressed as mean ± SE of 3–5 independent experiments. Bbs4 silenced (white bars); control cells (black bars). Columns with a superscript are significantly different (P < 0.05). Any bars without visible SE had SE less than the smallest unit on the graph

