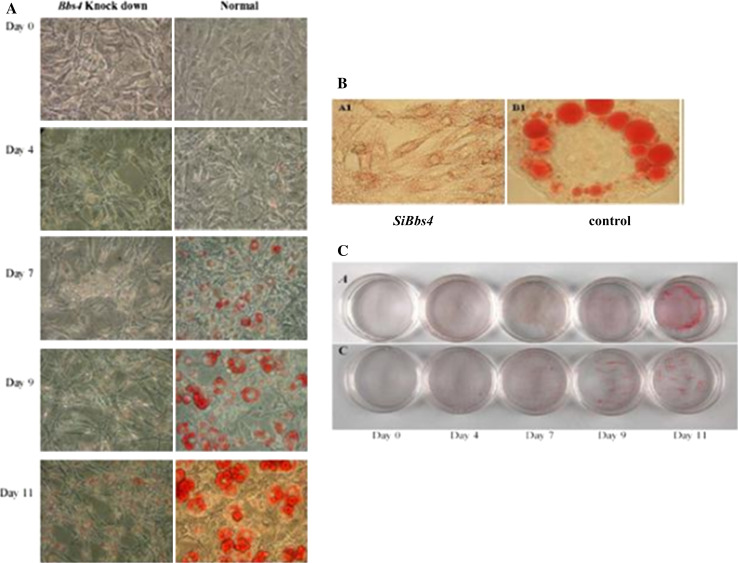
Fig. 3.
Fat accumulation pattern in Bbs4 silenced adipocytes. Differentiation was induced as described in materials and methods. a Fully differentiated cells (day 11) were subjected to ORO staining (left—Bbs4 silenced, right—control) and are shown at ×10 magnification. b Cells were subjected to ORO staining at different time intervals throughout differentiation and shown at ×40 magnification (upper panel- Bbs4 silenced cells, lower panel-control cells). c Photographs (no magnification) of cell culture wells of adipocytes in different days of differentiation (upper—SiBbs4, lower—control adipocytes)

