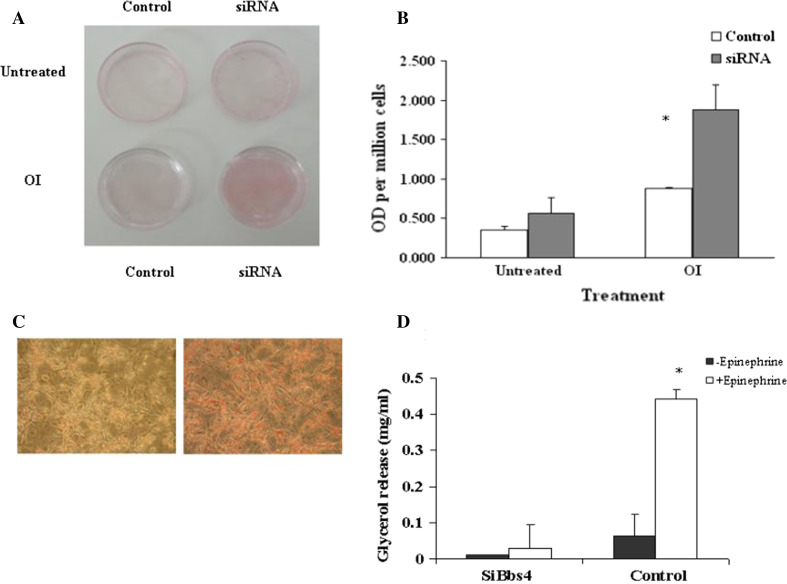
Fig. 4.
Accelerated fat accumulation of Bbs4 silenced adipocytes. Cells were differentiated as described in materials and methods, until day 7. a Photographs (no magnification) of Bbs4 silenced and control cells with and without OI (oleic acid 1,800 μM + 5 μg/ml insulin) treatment. Bbs4 silenced cells after OI treatments (day 7). Micrographs were taken at ×20 magnification. b Quantitative analysis of the effect of OI treatment on TG accumulation in Bbs4 silenced cells versus control adipocytes. Values are given as mean ± SD of three independent experiments. c Micrographs (at ×20 magnification) of Bbs4 silenced and control cells with OI. d Differentiated (day8) Bbs4 silenced (left) and control (right) cells were on analyzed for glycerol release as described in materials and methods. Values are given as mean ± SD (n = 3)

